Download
1 / 21
230 likes | 545 Vues
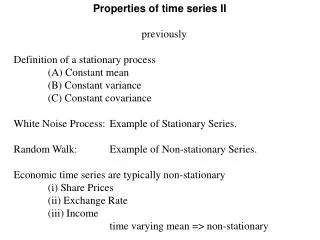
Properties of time series II. previously Definition of a stationary process (A) Constant mean (B) Constant variance (C) Constant covariance White Noise Process: Example of Stationary Series. Random Walk: Example of Non-stationary Series.

E N D
Properties of time series II previously Definition of a stationary process (A) Constant mean (B) Constant variance (C) Constant covariance White Noise Process: Example of Stationary Series. Random Walk: Example of Non-stationary Series. Economic time series are typically non-stationary (i) Share Prices (ii) Exchange Rate (iii) Income time varying mean => non-stationary
Properties of time series II Share Price Exchange Rate Income
Properties of time series II Why is non-stationarity important? (A) Assumptions of the Classical Regression Model (B) Spurious Regression Problem Reading: Thomas 13.2 Non-stationary variables and the classical model Other issues in this lecture (i) Order of Integration (ii) Dealing with non-stationarity (a) Deterministic Trends (b) Stochastic Trends
Properties of time series II: Why is stationarity important? Stationarity is an assumptions about explanatory variables in the Classical Regression ModelYt = α + βXt + ut - Typical regression model assumes that variance of time series (Xt) should tend to fixed finite constants in large samples However, variables are typically stochastic in economics (mean and variance changes from sample to sample) - probablility limit of these variances should equal fixed finite constants Background Reading on Classical Regression Model R L Thomas Chapter Six.
Properties of time series II: Classical Regression Model? Contd... Inference (using t-statistics) in classical regression analysis is based on large sample theory. - large sample theory is of no use if variance does not converge on a constant - Consistency of OLS breaks down - sampling distribution takes non-standard form. - Can no longer use the t-distribution - normal hypothesis testing becomes invalid Consequently, we can not use t-statistics in regression with non-stationary data. Classical regression model was devised to deal with relationships between stationary variables. Should not be applied to non-stationary series.
Spurious Regression Problem A significant problem associated with econometric estimation using non-stationary variables is that of spurious regression - if an independent variable in a regression has a trend it is likely that the dependent variable will also have a trend - for example the consumption function Ct = β0 + β1Yt + εt - Trend dominated equations are likely to have (a) highly significant t-statistics (b) high value for the coefficient of determination R2
Spurious Regression Problem yt = yt-1 + ut ut ~ iid(0,σ2) xt = xt-1 + vt vt ~ iid(0,σ2) utandvtare serially and mutually uncorrelated yt = β0 + β1xt + εt since yt and xtare uncorrelated random walks we should expect R2 to tend to zero. However this is not the case. Yule (1926): spurious correlation can persist in large samples with non-stationary time series. - if two series are growing over time, they can be correlated even if the increments in each series are uncorrelated
Spurious Regression Problem Granger and Newbold (1974) - more recent study of non-stationary data and implications - simulation using repeated independent random walks yt = yt-1 + ut xt = xt-1 + vt yt = β0 + β1xt + εt yt and xtare independent but strong correlation between ytand yt-1, and also between xtand xt-1. - regression of yt on xt gave high R2but a low Durbin- Watson (DW) statistic - t-statistic often suggested a relationship when the series were independent - ran the regression in first difference there was a low R2and a DW statistic which was close to 2 Phillips (1986) confirmed these simulation results theoretically. β1 converges on a random variable
Spurious Regression Problem Two random walks generated from Excel using RAND() command hence independent yt = yt-1 + ut ut ~ iid(0,σ2) xt = xt-1 + vt vt ~ iid(0,σ2)
Spurious Regression Problem Plot Correlogram using PcGive (Tools, Graphics, choose graph, Time series ACF, Autocorrelation Function) yt = yt-1 + ut ut ~ iid(0,σ2) xt = xt-1 + vt vt ~ iid(0,σ2)
Spurious Regression Problem Estimate regression using OLS in PcGive yt = β0 + β1xt + εt based on two random walks yt = yt-1 + ut ut ~ iid(0,σ2) xt = xt-1 + vt vt ~ iid(0,σ2) EQ( 1) Modelling RW1 by OLS (using lecture 2a.in7) The estimation sample is: 1 to 498 Coefficient t-value Constant 3.147 25.8 RW2 -0.302 -15.5 sigma 1.522 RSS 1148.534 R^2 0.325 F(1,496) = 239.3 [0.000]** log-likelihood -914.706 DW 0.0411 no. of observations 498 no. of parameters 2
Order of Integration Definition A time series is said to be integrated of order d, written I(d), if after being difference d times it becomes stationary. Series which are stationary without differencing are I(0). Many series are I(1) and hence they become stationary after differencing once. For example, Yt ~I(1) implies Yt – Yt-1 = ΔYt ~I(0)
How do we deal with non-stationarity? Simple approaches • (a) Deterministic Trend • - we can incorporate a deterministic time trend • Zt = β1trend +ut =>Zt* = Zt - β1trend • Ztis a difference stationary process (DSP)
How do we deal with non-stationarity? Simple approaches • (a) Deterministic Trend • Xt = Xt-1+ut and Xt = β1trend + ut • =>Xt* = Xt - β1trend => (non-stationary) • - however, detrending a stochastic trend with a deterministic trend (i.e. time trend) does not result in a stationary variable
How do we deal with non-stationarity? Simple approaches (b) First difference Nelson and Plosser (1982) suggest that most time series have a stochastic trend. yt = yt-1 +ut Hence if we first difference this produces a stationary variable. Run regression with variables that are stationary by first differencing avoids spurious regression problem. - t-statistics and R2 can be used for inference. yt = β0 + β1xt + εt and subtracting yt-1 = β0 + β1xt-1 + εt-1 => Δyt = θ1Δxt + vt
Dealing with non-stationarity First differenced random walks (i.e. difference stationary variables) Δyt = yt - yt-1 = ut ut ~ iid(0,σ2) Δxt = xt - xt-1 = vt vt ~ iid(0,σ2) Plot correlograms and time series
Dealing with non-stationarity Estimate regression in first differences using OLS Δyt = θ1Δxt + vt based on two first differenced random walks (ie difference stationary processes DSP) Δyt = yt - yt-1 = ut ut ~ iid(0,σ2) Δxt = xt - xt-1 = vt vt ~ iid(0,σ2) EQ( 2) Modelling DRW1 by OLS (using lecture 2a.in7) The estimation sample is: 2 to 498 Coefficient t-value DRW2 -0.028 -0.601 sigma 0.299 RSS 44.246 R^2 0.001 F(1,495) = 0.3579 [0.550] log-likelihood -104.137 DW 1.92 no. of observations 497 no. of parameters 1
How do we deal with non-stationarity? Caveats Trend or Difference Stationary Processes? TSP or DSP? (1) Although Nelson and Plosser (1982) suggest that most time series have a stochastic trend, literature is undecided eg Cochrane (1988) suggests US real GDP follows a deterministic trend. (TSP more applicable for real variables) (2) May be preferable to work in logs for some time series. e.g., absolute growth rate when output is low will be much smaller than absolute growth rate when output is large. Percentage growth rate is much more constant. (3) However it may not be so costly to overdifference. Evidence is more apparent for underdifferencing.
How do we deal with non-stationarity? Caveats First differencing a Stochastic Trend - Warning Assuming we have correctly identified a stochastic trend. It may not necessarily be worthwhile adopting the simple approach yt = β0 + β1xt + εt Δyt = θ1Δxt + vt We loose important information about β0. This would be the autonomous level of consumption if there was no income. Also we do not get an idea of the coefficient on β1 the long run relationship.
Caveats about First Differencing Loosing Long Run information Valid representation of equilibrium relationship between yt and xt yt = β0 + β1xt + εt 1. Three scenarios at end of period t-1 (a) Y equals its equilibrium value yt-1 = β0 + β1xt-1 (b) Y is below its equilibrium value yt-1 < β0 + β1xt-1 (c) Y is above its equilibrium value yt-1 > β0 + β1xt-1 2. Three scenarios at end of period t (a) Y equals its equilibrium value yt = β0 + β1xt (b) Y is below its equilibrium value yt < β0 + β1xt (c) Y is above its equilibrium value yt > β0 + β1xt Δyt = θ1Δxt + vt holds, only if 1(a) and 2(a) hold. Change in Y depends on change in X and relationship between X and Y in the previous period.
Non-stationarity: some cautionary words. Main conclusion: It is important to carefully consider whether time series is trend or difference stationary. Test formally using the methods of Dickey and Fuller. But do not loose sight of spurious regression problem. Preoccupation about stationarity lead researchers to loose sight of main objective. Estimating regression equations with non-stationary data which we can rely upon.