Download

1 / 85
860 likes | 1.04k Vues
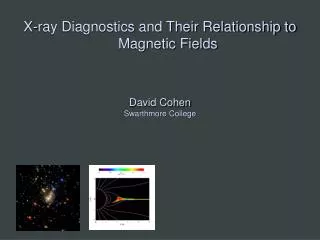
X-ray Diagnostics and Their Relationship to Magnetic Fields. David Cohen Swarthmore College. Launched 2000: superior sensitivity, spatial resolution, and spectral resolution. Chandra. XMM-Newton. sub- arcsecond resolution.

E N D
X-ray Diagnostics and Their Relationship to Magnetic Fields David CohenSwarthmore College
Launched 2000: superior sensitivity, spatial resolution, and spectral resolution Chandra XMM-Newton sub-arcsecond resolution
Both have CCD detectors for imaging spectroscopy (at low spectral resolution: R~20 to 50) Chandra XMM-Newton And – with lower sensitivity – both have grating spectrometers with resolutions of a few 100 to ~1000
Chandra ACISOrion Nebula Cluster (COUP) q1Ori C Color coded according to photon energy (red: <1keV;green 1 to 2 keV; blue > 2 keV)
q1Ori C: X-ray lightcurve Stelzer et al. 2005
sOri E: XMM light curve Sanz-Forcada et al. 2004
XMM EPIC spectrum of sOri E Sanz-Forcada et al. 2004
1 Ori C z Pup Differences between 1 Ori C and a normal O star
Hot plasma emitting thermal x-rays 1 keV ~ 12 × 106 K ~ 12 Å Shock heating: Dv = 300 km gives T ~ 106 K (and T ~ v2) ROSAT 150 eV to 2 keV Chandra, XMM 500 eV to 10 keV
Chandra grating spectra 1 Ori C z Pup 1Ori C: hotter plasma, narrower emission lines zPup: cooler plasma, broad emission lines
1 Ori C z Pup H-like/He-like ratio is temperature sensitive Mg XII Mg XI Si XIV Si XIII
1 Ori C z Pup The magnetic O star – 1Ori C – is hotter Mg XII Mg XI Si XIV Si XIII
Differential Emission Measure (temperature distribution) q1Ori C is much hotter Wojdowski & Schulz (2005)
q1 Ori C(O7 V) z Pup(O4 If) Emission lines are significantly narrower, too 1000 km s-1
Dipole magnetic field Wade et al. 2008
Rotating tilted dipole Simulation/visualization courtesy R. Townsend
MHD simulations of magnetically channeled wind temperature emission measure simulations by A. ud-Doula; Gagné et al. (2005) Channeled collision is close to head-on:Dv > 1000 km s-1 : T > 107 K
Differential emission measure (temperature distribution) MHD simulation of 1Ori C reproduces the observed differential emission measure Wojdowski & Schulz (2005)
0.4 1.5 0.3 1.0 Simulation EM (1056 cm-3) 0.2 θ1 Ori C ACIS-I count rate (s-1) 0.5 0.1 0.0 0.0 0.0 0.2 0.4 0.6 0.8 1.0 Rotational phase (P=15.422 days) Chandra broadband count rate vs. rotational phase Model from MHD simulation
0.4 1.5 0.3 1.0 Simulation EM (1056 cm-3) 0.2 θ1 Ori C ACIS-I count rate (s-1) 0.5 0.1 0.0 0.0 0.0 0.2 0.4 0.6 0.8 1.0 Rotational phase (P=15.422 days) The star itself occults the hot plasma torus The closer the hot plasma is to the star, the deeper the dip in the x-ray light curve
Emission measure contour encloses T > 106 K
Helium-like species’ forbidden-to-intercombination line ratios – f/i or z/(x+y) – provide information about the location of the hot plasma …not the density, as is usually the case.
Helium-like ions (e.g. O+6, Ne+8, Mg+10, Si+12, S+14) – schematic energy level diagram 1s2p 1P 10-20 eV 1s2p 3P 1s2s 3S resonance (w) forbidden (z) 1-2 keV intercombination (x+y) g.s. 1s21S
Ultraviolet light from the star’s photosphere drives photoexcitation out of the 3S level 1s2p 1P 1s2p 3P UV 1s2s 3S resonance (w) forbidden (z) intercombination (x+y) g.s. 1s21S
The f/i ratio is thus a diagnostic of the local UV mean intensity… 1s2p 1P 1s2p 3P UV 1s2s 3S resonance (w) forbidden (z) intercombination (x+y) g.s. 1s21S
…and thus the distance of the x-ray emitting plasma from the photosphere 1s2p 1P 1s2p 3P UV 1s2s 3S resonance (w) forbidden (z) intercombination (x+y) g.s. 1s21S
Rfir=2.1 R* Rfir=1.2 R* Rfir=4.0 R*
He-like f/i ratios and the x-ray light curve both indicate that the hot plasma is somewhat closer to the photosphere of q1Ori C than the MHD models predict.
Conclusions Normal massive stars have x-ray line profiles consistent with the predictions of the wind instability model. Photoelectric absorption’s effect on the profile shapes can be used as a mass-loss rate diagnostic: mass-loss rates are lower than previously thought. Later-type massive stars have X-rays that are harder to understand, though…
Stellar rotation vs. X-ray luminosity low-mass stars high-mass stars No trend
What about late O and early B stars with big filling factors and narrow lines?