Download
1 / 30
300 likes | 491 Vues
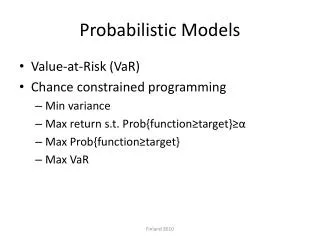
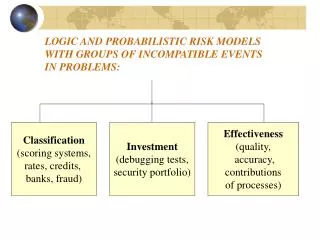
LOGIC AND PROBABILISTIC RISK MODELS WITH GROUPS OF INCOMPATIBLE EVENTS IN PROBLEMS :. Classification ( scoring systems , rates , credits, banks, fraud ). Investment ( debugging tests, security portfolio ). Effectiveness ( quality , accuracy , contributions of processes ).

E N D
LOGIC AND PROBABILISTIC RISK MODELSWITH GROUPS OF INCOMPATIBLE EVENTSIN PROBLEMS: Classification (scoring systems, rates, credits, banks, fraud) Investment (debugging tests, securityportfolio) Effectiveness (quality, accuracy, contributions of processes)
PROBLEMS OF RISK LP-MODELS WITH GIE 1.Tabular representation of the statistical data 2. Construction of scenario and structure risk models 3. Definition of parameter-events and grade-events 4. Definition of groups of incompatible events (GIE) 5.Quantization of distributions of random grade-events 6. Generation of arbitrary discrete distributions 7. Construction of the logic risk model 8. Orthogonalization of the logic risk model 9. Construction of the probabilistic risk model 10. Optimization (identification) of the LP-risk model 11. Determination of connection of risk parameters Yad, Risk, Nad, Had 12. Analysis of risk by contributions of grade-events into Yad, Risk, Nad, Had
PUBLICATIONS by E.D. Solojentsevin the field of the risk LP-models with GIE 1. Solojentsev E. D. Scenario Logic and Probabilistic Managementof Risk in Business and Engineering. Springer: 2004, 392 p. 2. Solojentsev E. D., Karassev V. V., Solojentsev V.E., Logic and probabilistic models of risk in banks, business and quality. SPb.: Nauka, 1999, 120 p. 3. Solojentsev E. D., Karassev V. V.Logic and probabilistic risk models in business with groups ofincompatible events. Economics and mathematics methods, 2003; 1:90--105. 4. Solojentsev E.D., Karassev V.V. Risk logic and probabilistic models in business and identification of risk models. - Informatica 25 (2001) 49-55. 5. Solojentsev E. D., Karassev V. V.Identification of logic and probabilistic models of risk of structure--complex systems with groups of incompatible events. - Automation and Remote Control, 2002; 3:97--113. 6. Solojentsev E.D. Peculiarities of Logic and Probabilistic Theory with Groups of Incompatible Events.- Automation and Remote Control, N 7, 2003, p.p.187-204. 7. Rybakov A.V., Solojentsev E.D. Optimization in Identification of of Logical Probabilistic Models of Risks.- Automation and Remote Control, N 7, 2003, p.p. с.с.51-63. 8. Solojentsev E. D., Alekseev V. Logic andprobabilistic theory of security portfolio risk. Proceedings of the Third International Scientific School: Modelling and Analysisof Safety and Risk in Complex Systems; 2003 August 20-23; SaintPetersburg: SPbSUASI, 2003. 9.Solojentsev E.D., Dormidonov Yu. Risk theory in problems of effectiveness and accuracy // In book : Theoretical substantiation of methodic approaches to construction of monitoring systems of technical condition of complex systems. SPb. MSA named Mojaiskiy, 2004.
RISK LP-THEORYIS ALTERNATIVETO SCORING SYSTEMS OF CREDIT RATES • Scoring systems of credit rates is based on: • linearmultiple-factorregression; • logistic regression; • classification tree; • Neural Network; • data mining technique. • Scoring system function: • Establish whetherborrowercould pay a loan i.e. to give or not to give a credit. • Decision taken is not explained.
THE FUNCTIONS OF LP-ESTIMATIONAND CREDIT RISK ANALYSIS SYSTEM 1. Determination of the credit risk: 1) Estimation of credit risk; 2) Classification of the credit (“good” or “bad”); 3) Determination of the price for risk of the credit; 4) Analysis of the credit risk; 2. Analysis of the credit activity of bank: 5) Determination of the contributions of signs (characteristics) and of sign grades of a credit in the average credit risk of bank; 6) Determination of the contributions of signs and of signs grades of a credit in accuracy of classification of the credits; 7) Optimization of number of signs and grades, splitting into intervals (sum and period of the credit, age of clients) for higher of accuracy of classification of the credits 3. Identification and estimation of quality of risk LP-models: 8) Statistical analysis of the risk model; 9) Combinatorial analysis of the risk model; 10) Probability estimation of grade-events and the admitted risk; 11) Estimation of accuracy of the risk LP-model; 12) Estimation of robustness of the risk LP-model; 13) Choice of the ratio of the incorrectly classified bad and good credits.
ADVANTAGES OF THE RISK LP-THEORY WITH GIE Risk LP-theory and concerning Software isalternative meansrelativelyto scoring techniques of credit rates.They have following advantages: • Almost two times higher accuracy in classification than other well-known models of risks; • Almost seven times higher robustness (stability) in classification than other well-known models of risks; • A big number of new tasks of analysis and management of riskscan be solved (13 instead of1 in scoring techniques); • Transparency of the risk model and results ofestimation and analysis of risk.
SCENARIO OF CREDIT RISK The scenario of the credit risk is associative and formulated based on the common sense so: the non-success of credit occurs if any one, or two, . . . , or all initiating events occur
SIGNS AND GRADES OF CREDITS OF NATURAL PERSONS • Sign of successfulness of credit -- Y (2 grades). • Signs of credit: Z1– checking account with bank (4 grades), Z2 – duration of loan (10), Z3 – credit history (5), Z4 – intended use of loan (11), Z5 – amount of loan (10), Z6 – savings account, securities account (5), Z7 – duration of employment (5), Z8 –height ofinstallment (in % of available income) (4), Z9 – marital status and sex (4), Z10 – joint liability or guarantor (3), Z11 – time spent in current residence (4), Z12 -- equities (4), Z13 -- age(5), Z14 – more loans (3), Z15 -- residence (3), Z16 – number of loans with bank including new loan (4), Z17 – profession (4), Z18 – support for family or other person (2), Z19 -- phone (2), Z20 – foreign worker (2).
Y (A, B1, B2, B3, C1, C2, C3) 0 Z1 (1, 2, 3, 4, 5, 6) Z2 (1, 2, 3) Z3 (1, 2, 3) 1 Z11 (1, 2, 3, 4) Z12 (1, 2, 3, 4) Z31 (5, 3, 0) Z32 (5, 3, 0) Z33 (5, 3, 0) Z34 (5, 0) 2 Z111 1 2 3 4 Z112 1 2 3 4 Z113 1 2 3 4 Z114 1 2 3 4 Z115 1 2 3 4 Z116 1 2 3 4 Z311 2 1 1 Z312 5 3 0 Z313 5 3 0 Z321 5 4 3 2 1 Z322 5 4 3 2 1 Z323 5 4 3 2 1 Z331 5 3 0 Z331 5 3 0 3 STUCTURE CHARTOF LP-MODEL OF DEFAULT FOR JURIDICAL PERSONS
Numbers of credits Sign, Z1 … Sign, Zj … Sign, Zn Sign of successfulness of credit, Y 1 … … … … i Zjr … N … … … TABULAR PRESENTATIONOF DATA «CREDITS ANDSIGNS» Number of different credits: Nmax = N1 *…Nj *…Nn Frequency of grade-event: Wjr =Njr / N, j=1,2,…,n; r=1,2,…Nj
THE FRAME OF THE TABLE «CREDITSANDGRADESOF THEIR SIGNS» • YZ1Z2 Z3Z4Z5Z6Z7Z8Z9Z10Z11Z12Z13 Z14 Z15 Z16Z17Z18Z19Z20 • 1 1 3 5 3 3 1 2 4 2 1 4 2 1 3 1 1 3 1 1 1 • 1 1 2 51 5 1 3 2 3 1 2 1 2 3 1 2 3 2 1 1 • 1 2 3 3102 2 4 2 2 1 4 1 1 3 1 1 2 1 1 1 • 1 1 1 5 4 4 1 4 1 2 1 4 3 2 3 2 1 3 1 1 1 • 1 2 8 4 11 7 2 1 2 3 1 4 4 1 3 3 1 4 1 2 1 • 1 1 4 3 4 4 5 4 2 4 1 4 3 1 3 1 2 2 1 1 1 • 0 2 7 3 6 4 1 2 4 3 1 1 4 2 3 1 1 2 1 1 1 • 1 2 3 5 5 3 1 4 4 3 1 3 2 2 3 2 1 3 1 1 1 • 1 1 1 5 1 5 5 2 1 3 1 3 1 3 3 2 2 2 2 11 • 1 2 2 4 4 5 1 4 2 3 1 4 2 3 3 2 1 3 1 1 1 • 1 1 3 3 3 2 1 54 2 1 4 2 1 3 1 1 3 1 1 1 • 1 2 7 3 2 6 1 3 2 3 1 2 32 3 1 1 4 1 2 1 • 1 2 8 1 10 8 5 3 2 3 1 2 3 3 1 2 1 4 1 2 1 • 0 1 6 3 3 5 1 5 4 3 1 2 3 3 3 2 1 3 2 1 1 • 0 1 2 3 7 2 1 3 4 3 1 4 3 3 3 1 1 2 2 1 1 • 1 1 4 3 2 4 1 4 2 3 1 1 4 3 3 3 1 4 1 2 1 • 1 1 3 5 1 6 1 5 2 3 1 4 4 3 3 3 3 4 1 2 1 • 1 1 6 3 3 5 1 3 1 3 3 2 2 2 3 2 1 3 2 1 1 • 0 1 4 3 5 2 2 1 4 2 1 3 2 1 3 2 1 3 1 1 1 • 0 1 2 3 3 7 1 5 4 3 1 4 4 3 3 3 1 4 1 2 1
a Class 1 Class 2 Class 3 Class 4 |____________|__________|_________|_________|____________|____| 0 P P P P P 1 min ad1 ad2 ad3 max . STRUCTURAL RISK MODELS AND SCHEMEOF CLASSIFICATION OF CREDITS
PROBABILITIES OF GRADE-EVENTS IN GIE Bayes’ formula:
BASIC EQUATIONS Logical risk function: Orthogonal logical risk function: Probabilistic risk function: P = P1 + P2Q1 + P3Q1Q2 + … Wjm = 1/ Nj ;
IDENTIFICATION OF RISK LP-MODEL Are given:the table “credits and signs" and therisk P - model; To determine: probabilities Pjr , r = 1,2,…,Nj, j = 1,2,…,n andadmissible risk Pad; The criterion function: F=Nbs+Ngs MAX; Accuracy coefficients of risk P-model: Eg = ( Ng - Ngs ) / Ng; Eb = ( Nb - Nbs ) / Nb, Em = ( N - F ) / N ; Limitations :0 < Pjr < 1, j = 1,2,…,n , r = 1,2,…,Nj Pjr = Pjr * ( Pav / Pm ) j = 1,2,…,n , r = 1,2,…,Nj E gb = (Ng - Ngs ) / (Nb - N bs ).
RISK ANALYSIS Contribution of the sign in the risk of the object i dPj = P(i)- P(i)| Pj =0, j=1,2,...,n. Contribution of the sign in the average risk Pm of set of objects dPjm = Pjm - Pjm | Pj=0, j=1,2,...,n. Contribution of grades in the average risk Pmof set of objects dPjrm = Pjm - Pjm | Pjr=0, j=1,2,...,n, r = 1,2,…,Nj. Contribution of the sign in the criterion functionFmax dF j = Fmax - F | Pj = 0 , j=1,2,...,n. Contributions of grades Ejrg = (Njrg - Njrgs)/Njrg; Ejrb = (Njrb -Njrbs)/Njrb; Ejrm = (Njr -Njrs)/Njr ,
CREDITS RISKS AFTER SORTING Price for risk:Ci = Cad + C • ( Pi - Pad )
Used method Bad credits classification error, Eb Good credits classification error, Eg The average error, Em Linear discriminant analysis 1 ( LDA) 0,26 0,279 0,273 Linear discriminant analysis 2 ( LDA) 0,287 0,291 0,29 Quadratic discriminant analysis 1 ( QDA) 0,183 0,283 0,253 Quadratic discriminant analysis 2 ( QDA) 0,283 0,34 0,323 Cluster analysis ( CART ) 0,273 0,289 0,285 Neural network 1 (NN) 0,38 0,24 0,282 Neural network 2 ( NN ) 0,24 0,312 0.29 LP-model with GIE – Var.1 0,167 0,201 0,191 LP-model without GIE – Var.2 0,1433 0,190 0,176 LP-model with GIE after structural identification - Var. 3 0,126 0, 174 0,155 COMPARISON OF DIFFERENT METHODS OFESTIMATIONOF CREDIT RISKSBYACCURACY
Comparison of different methods robustness in credits classification With take account GIE Without take account GIE Variants ng nb ngb Variants ng nb ngb 1 & 2 9 9 18 1 & 2 80 80 160 2 & 3 9 9 18 1 & 3 45 45 90 1 & 3 8 8 16 2 & 3 68 68 136 1 & 4 60 60 120 2 & 4 76 76 152 3 & 4 50 50 100 COMPARISON OF DIFFERENT METHODS OF ESTIMATIONOF CREDIT RISKSBYROBUSTNESS
INTEGRAL RESULTSOF IDENTIFICATION OFCREDIT RISK LP-MODEL • Fmax = 820 • Nopt = 4 • NS1 = 700 • NS0 = 300 • Pav = 0.300000 • NL1 = 610 • NL0 = 390 • PLmin = 0.225352 • PLmax = 0.377661 • dPc = 0.152309 • PLm = 0.299815 • Pad = 0.306213 • NL01 = 135 • NL10 = 45 • K1 = 0.002000
ANALYSIS OF BANK CREDIT ACTIVITY • Pjm[1] = 0.020293 P1jm[1] = 0.274190 • Pjm[2] = 0.012180 P1jm[2] = 0.061007 • Pjm[3] = 0.009075 P1jm[3] = 0.103294 • Pjm[4] = 0.021151 P1jm[4] = 0.090019 • Pjm[5] = 0.017402 P1jm[5] = 0.080651 • Pjm[6] = 0.022386 P1jm[6] = 0.276516 • Pjm[7] = 0.018549 P1jm[7] = 0.208358 • Pjm[8] = 0.017788 P1jm[8] = 0.267971 • Pjm[9] = 0.014318 P1jm[9] = 0.184397 • Pjm[10] = 0.018399 P1jm[10] = 0.321659 • Pjm[11] = 0.018874 P1jm[11] = 0.254490 • Pjm[12] = 0.017096 P1jm[12] = 0.246005 • Pjm[13] = 0.018820 P1jm[13] = 0.205216 • Pjm[14] = 0.014800 P1jm[14] = 0.228591 • Pjm[15] = 0.017578 P1jm[15] = 0.262706 • Pjm[16] = 0.022042 P1jm[16] = 0.339911 • Pjm[17] = 0.018632 P1jm[17] = 0.228849 • Pjm[18] = 0.017428 P1jm[18] = 0.479042 • Pjm[19] = 0.018133 P1jm[19] = 0.507708 • Pjm[20] = 0.018366 P1jm[20] = 0.774331
PROBABILITIESANDCLASSIFICATION MISTAKESOF GRADES-EVENTSFOR FIRST SIGN OF CREDIT • P1[1] = 0.034313 P1_1[1] = 0.463907 • P1[2] = 0.032726 P1_1[2] = 0.442442 • P1[3] = 0.001937 P1_1[3] = 0.026188 • P1[4] = 0.004990 P1_1[4] = 0.067464 • E1[1]g=0.025000 E1[1]b=0.314433 E1[1]m=0.229927 • E1[2]g=0.077586 E1[2]b=0.372549 E1[2]m=0.245353 • E1[3]g=0.160714 E1[3]b=0.285714 E1[3]m=0.174603 • E1[4]g=0.069832 E1[4]b=0.416667 E1[4]m=0.101523