Improved Satellite Fire Detection Trends in Western Hemisphere since 1995
10 likes | 112 Vues
Explore advancements in fire detection technology using the Wildfire Automated Biomass Burning Algorithm (WF_ABBA) from 1995 to present, providing high-quality data for trend analyses. Understand the algorithm upgrades and noise filtering to enhance accuracy.

Improved Satellite Fire Detection Trends in Western Hemisphere since 1995
E N D
Presentation Transcript
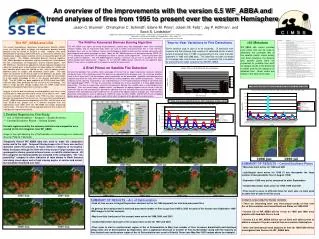
An overview of the improvements with the version 6.5 WF_ABBA and trend analyses of fires from 1995 to present over the western Hemisphere Jason C. Brunner1, Christopher C. Schmidt1, Elaine M. Prins2, Joleen M. Feltz1, Jay P. Hoffman1, and Scott S. Lindstrom1 1Cooperative Institute for Meteorological Satellite Studies (CIMSS)/Space Science Engineering Center (SSEC), University of Wisconsin-Madison 2Consultant in environmental remote sensing applications, Grass Valley, CA http://cimss.ssec.wisc.edu/goes/burn/wfabba.html jason.brunner@ssec.wisc.edu The WF_ABBA and LBA The current Geostationary Operational Environmental Satellite (GOES) series has had the ability to detect and characterize biomass burning primarily since the launch of GOES-8 in 1995. However, fires were detected with the previous GOES VAS series as well, but fire detection was hindered due to poor spatial resolution (16 km at sub-satellite point for 3.9 micron band). The Wildfire Automated Biomass Burning Algorithm (WF_ABBA) provides fire detections and fire characteristics (instantaneous fire size, instantaneous fire temperature, and fire radiative power). The WF_ABBA has recently been upgraded to include improved metadata that allows for tracking when a specific place was observed by the satellite and why individual pixels were not labeled as fires, such as opaque clouds, block-out zones for sunglint, and disallowed surface types. This data allows for correction of the diurnal cycle of fire detections for places and times where fires could not be detected, which will enable the construction of a high quality climatology of fires in the western hemisphere since 1995. The WF_ABBA has been applied to all GOES-8 data from 1995-1999 and 2001-2002, producing the first version of this climatology. This effort is made possible through funding from the NASA Large Scale Biosphere-Atmosphere Experiment in Amazonia (LBA). Analysis of the fire data immediately revealed problems with noise in the GOES-8 data in 1995 and 1996 and to a much lesser extent in 1997. 1996 has been excluded from this poster while 1995 has been retained to illustrate the magnitude of the noise issue. The noise filter associated with the WF_ABBA has performed exceptionally since 2001, but the noise in the early GOES-8 was greater and of a different character than any experienced since 2000 when the WF_ABBA first began processing realtime data. The noise filter is being upgraded and once that is done the 1995 data will improve dramatically. The WildFire Automated Biomass Burning Algorithm The WF_ABBA uses inputs consisting of geostationary satellite data, total precipitable water from numerical forecast models, and an ecosystem map, which are used to detect and characterize fires in near real-time, providing users such as the National Oceanic and Atmospheric Administration and the hazards community with high temporal and spatial resolution fire data. Today the WF_ABBA processes all data generated by GOES-10/-11/-12, Meteosat-9, and MTSAT-1R, detecting fires within a satellite zenith angle of 80° (covering the better part of the visible hemisphere). The WF_ABBA algorithm requires a minimum 3.9 μm and 11 μm bands that meet certain performance requirements. However, for the new WF_ABBA version (Version 6.5), the algorithm does better if it has access to visible and 12 μm bands as well for the cloud mask. A Brief Primer on Satellite Fire Detection Infrared fire detection from satellites takes advantage of the fact that as target temperature increases radiance increases faster at the shortwave end of the spectrum as opposed to the longwave end. By using two windows such as the 3.9 μm and 11 μm fire locations and characteristics can be determined. Algorithms can determine the radiance due to the fire itself, within limits determined by viewing conditions and satellite characteristics. That fire radiance can be split into instantaneous size and temperature via the Dozier bispectral method or converted into fire radiated power (FRP). The key to successfully estimating any of those quantities is to have good radiance information. The key to successfully using fire characteristics derived from satellite data is understanding their limitations. Fires are almost always subpixel entities, and because the optical response of the sensor is not flat within the field of view, characteristics derived for individual fires are inherently likely to be biased low or high. However, when considering a large number of fires, the affect of the optical response averages out. Pixel radiance data from some platforms such as Meteosat-9, GOES-10 (unlike the other GOES), and MTSAT-1R are remapped before being sent to the users, a process which further alters the quality of the derived fire characteristics. Year-to-Year Variations in Fire Detections Some variation year to year is to be expected. Of particular note however are the relatively high numbers of saturated and to a lesser extent processed fires in 1995, corresponding to the noise that was prevalent in 1995 and 1996 data. This data has not been corrected for coverage rate, cloud cover, and so on, a process that is possible by processing the mask output by the v65 WF_ABBA. v65 Metadata WF_ABBA v65 output includes pixel codes that can be used to determine the coverage rate of the satellite (which varies widely over South America), the reasons why specific pixels were not processed for possible fires such as opaque clouds or the presence of water, and the fire category for detected fires. Mask codes are shown in the table to the right. *** Note that low possibility fires are often indicative of false alarms *** Note that low possibility fires are often indicative of false alarms 2 Detailed Regions for Fire Study *** Arc of Deforestation – Amazon – South America *** Central/Southern Plains – United States For both regions monthly fire summary statistics and composites were created for the fire categories from WF_ABBA Image to the right denoting Arc of Deforestation is from Ecoregions in Amazonia (Source: Philip M. Fearnside) Temporally filtered WF_ABBA data was used to make the composites below and to the right. Temporal filtering keeps a fire if there was another detection within the previous 12 hours within 0.1 degrees of its location. Noisy lines pass through the filter when they occur in large numbers due to geomagnetic storms, ground antenna issues, or satellite related issues. All fire categories but low possibility are included in the composites. The “low possibility” category is often indicative of false alarms in North America and along cloud edges and at high viewing angles at sunrise and sunset, but should be monitored over time. SUMMARY OF RESULTS – Central/Southern Plains • May/June most active for 1998 and 2001 • July/August most active for 1995 (if one disregards the large number of low possibility fires in August 1998) • September 1998 very active compared to other Septembers • October/November most active for 1995, 1999 and 2001 • Fires seem to occur at different times for each year, no main peak at same time of year for all the years SUMMARY OF RESULTS – Arc of Deforestation • Peak of fires occurs in August/September and most active for 1995 especially for total and processed fires • In general, decreasing trend in total and processed number of fires as go from 1995 to 2002 for peak of fire season (see September 1995-1999 images to left for example) • May/June/July (early part of fire season) more active for 1998,1999, and 2002 • October/November (later part of fire season) more active for 1997 and 2002 • Fires seem to start in southernmost region of Arc of Deforestation in May, then number of fires increases dramatically and develops along entire Arc of Deforestation by September, then a significant decrease in number of fires by November along with the majority of fires located over northeastern region of Arc of Deforestation near coast of Atlantic Ocean (see May-Nov 1997 images above for example) CONCLUSIONS/FUTURE WORK • There are interesting inter- and intra-annual trends of fires over Arc of Deforestation and Central/Southern Plains for 1995-2002 • Version 6.5 of WF_ABBA will be re-run on 1995 and 1996 once problem with bad data lines is fixed • Version 6.5 of WF_ABBA will be run on 2000 and 2003-current to obtain a complete 15 year record of fires over western Hemisphere • Inter- and intra-annual trend analyses of fires for 1995-2009 will be investigated from Version 6.5 WF_ABBA data