Making and Interpreting Graphs
Week 4 LSP 120 Joanna Deszcz. Making and Interpreting Graphs. 3 Types of Graphs used in QR. Pie Charts Very limited use Category sets must make a whole XY Graphs or Line Graphs Use with “a lot” of data points Bar Charts or Column Charts Very flexible Work well with limited data


Making and Interpreting Graphs
E N D
Presentation Transcript
Week 4 LSP 120 Joanna Deszcz Making and Interpreting Graphs
3 Types of Graphs used in QR • Pie Charts • Very limited use • Category sets must make a whole • XY Graphs or Line Graphs • Use with “a lot” of data points • Bar Charts or Column Charts • Very flexible • Work well with limited data • Compares more than one series
Pie Charts • Only used when have a quantitative variable associated with a list of categories • Both the categories and the quantities each add up to a whole • Categories must be disjoint – no overlapping
Most Common Pie Chart Mistakes • Use on set of categories that don’t make a whole • Use on categories that overlap • Include total in chart data • Let’s try an example • Leading Causes Of Death Tab
Creating a Pie Chart • Select labels and values • Choose Pie chart type • Choose layout • Must include % value, title and labels • Layout 6 does it all • Add the source in a text box
Labeling the Chart • Title should be descriptive • Consider who, what, when and where • Percents should be formatted to 2 decimal places • Format – Data Labels – Numbers – Percentage – 2 decimal places • Source – add in text box • Insert – Text Box – Draw text box on the chart and type in source • If not source give type “Unknown”
Chart Themes • Found on Page Layout Tab • Slide mouse over built-in themes • Chart will change to reflect each theme
The Result… Flow Theme applied to the chart
XY Graphs • Used with a lot of data • X-axis categories are numeric, (often years) • Choose xy graph option with connected data points
Note: Don’t use the Line Graph • Excel line graphs always treat the x-axis categorically instead of numerically • Causes endless array of mistakes • Use XY (Scatter) graph instead to avoid errors • Let’s try one • Lake Michigan Levels Tab
Creating XY (Line) Graphs • Select category labels and values • Choose Scatter chart option • Scatter with straight lines and markers type • 2nd row, 2nd column • Choose design layout 1 from Design tab
Labeling the Chart • Title should be descriptive • Consider who, what, when and where • Remove the legend from the chart • Not needed when there is only one series • Source – add in text box • Insert – Text Box – Draw text box on the chart and type in source • If not source give type “Unknown” • Apply a theme if you wish
Make Your Chart More Readable • XY Graphs often only take up a small range of values • If all data points located in a central area on the graph • Adjust y-axis so values start at or just below the lowest data point value • Right-click on y-axis • Choose Format axis • Adjust Minimum value
The Result… Solstice Theme applied to this chart
What’s the Story? • XY (Line) Graphs usually tell a story about the data • Analysis should carefully describe what the graph is saying • Start the “story” from the left and move to the right • Be sure to include the high point and the low point as well as anything that is interesting or unexpected • Write a well-written paragraph telling the “story”
Describing your graph • In a paragraph, point out what you want the reader to know about the graph • Examples: “In the Annual Averages of Lake Michigan/Lake Huron Water Levels chart we find that between 1988 and 1997 water levels in the lakes increased overall. The high point of the lake levels occurred in 1997 when the level was 176.98 meters. However, lake levels took a sharp decline in the following 2 years and reached their low point in 2003 when the level was only 175.89 meters. Since 2003 lake levels have increased slightly but appear to be declining once again.”
Bar Chart or Column Chart • Very flexible • Used when a quantitative variable is associated with the a categorical variable • Work well with limited data • Can compare more than one series
Note: Be Careful • If you do use a bar chart and have years along the x-axis • Be sure the years are in equal intervals. • Otherwise, you can be guilty of creating a misleading graph • Let’s try one • Home Heating Tab
Creating a Column Chart • Select the data including category labels and values • Choose Column Chart • 2-D Clustered column option • Add Titles and axis labels • Layout 9 works well
Labeling the Chart • Title should be descriptive • Consider who, what, when and where • Both the x-axis and y-axis should be labeled • Source – add in text box • Insert – Text Box – Draw text box on the chart and type in source • If not source give type “Unknown” • Apply a theme if you wish
Name Each Series in the legend • To change names • Click on chart to activate • Click on Design Tab • Under Data Group – choose Select Data • Data Series labels appear on left • Highlight label and click edit button • Type new series name in Edit Series Dialog box
The Result… Source: US Dept of Energy Aspect Theme applied to chart
Add the other column of data • Reselect the data to include all 3 columns
The New Result Source: US Dept. of Energy
Advantages of Multiple Bar Charts • Succinctness • Can make comparisons within categories and across categories • Best used in printed works • Can be carefully studied
Disadvantages • Can present too much information to view as part of presentation • Hard to make a single clear point with bar charts • Presenters don’t leave them up long enough to absorb info fully
Describing a Bar/Column Chart • Usually include high and low values in graph description • Not always effective/appropriate with bar/column charts • Include top 2 or 3 values instead • Low value may be insignificant • Often describes “Other” category • Not significant in the “story”
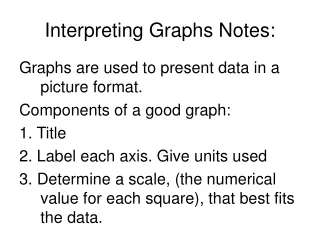
Guidelines for Creating an Effective Graph • What is the purpose of making a graph from this data? • What type of graph should you make? • Pie, bar, x-y scatter (line) • Decide on a title and consider the W's • (who, what, where and when) • Do you need to include a legend?
Guideline continued… • Add a descriptive x-axis and y-axis label for bar and xy-scatter graphs • Add percentages for pie charts, 2 decimal places • Adjust the scale for bar and xy-scatter graphs (if applicable) • Add source
Can the Graph Stand Alone? • A good graph should be able to stand alone • Without any words to tell the reader what they are looking at • If the reader doesn't understand the graph without a caption (or story) then the graph isn't very good
Faulty or Misleading Graphs • Data can be displayed "correctly" yet gives different messages depending on how it is displayed
Y-axis Scale Effects • Most common way to create a misleading graph • Y-axis scale should begin at 0 • Not always the case • Can work in favor of the one distributing the graph
Bad Chart Examples • What’s wrong with this chart
Another Bad Example – Misleading Graph Graph appeared in Chicago Tribune and on billboards along the Kennedy Expressway