SlideServe
Menu
Préférences
© SlideServe · v2026

Analyzing Categorical Data

tanginika-morris avatar
9 diapositives · 267 Views · Nov 13, 2014

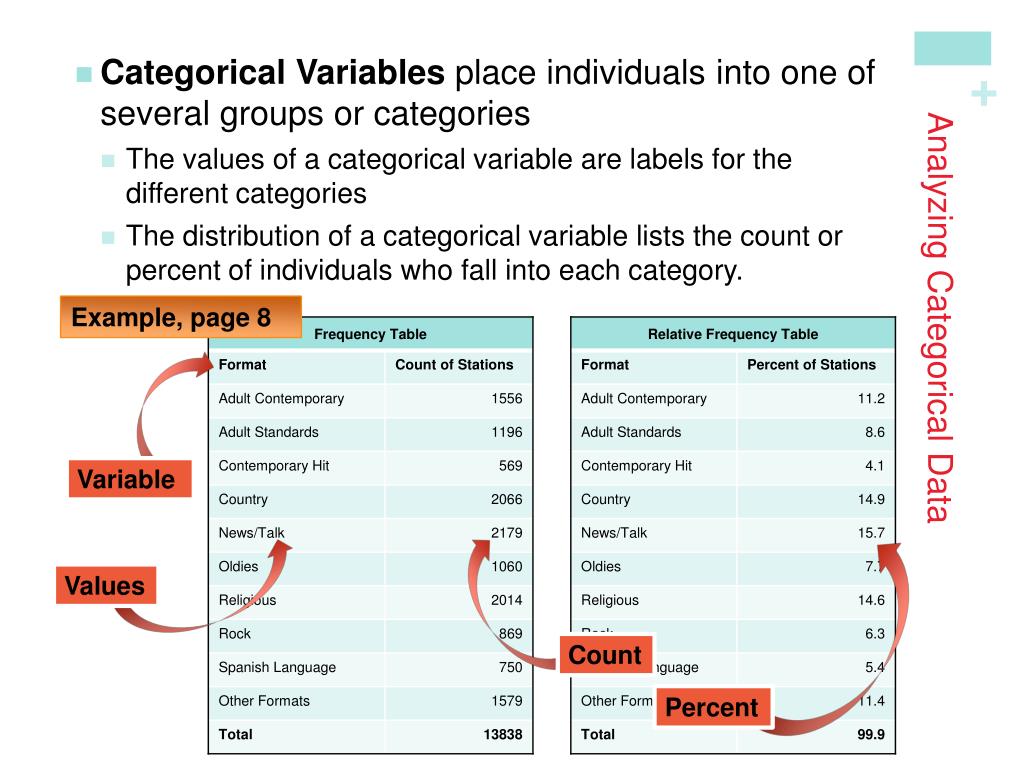
Analyzing Categorical Data. Categorical Variables place individuals into one of several groups or categories The values of a categorical variable are labels for the different categories
Analyzing Categorical Data - slide 1
01 / 9Analyzing Categorical Data
1 / 17

Télécharger la présentation

Analyzing Categorical Data
Une image / un lien ci-dessous est fourni (tel quel) pour télécharger la présentation

Politique de téléchargement : le contenu du site vous est fourni TEL QUEL pour votre information et votre usage personnel ; il ne peut être vendu, concédé sous licence ni partagé sur d’autres sites sans l’accord de son auteur.Le contenu vous est fourni TEL QUEL, pour votre information et votre usage personnel uniquement. Téléchargez la présentation en cliquant sur ce lien. Lors du téléchargement, si vous ne parvenez pas à télécharger une présentation, l’éditeur a peut-être supprimé le fichier de son serveur.Pendant le téléchargement, si vous ne parvenez pas à obtenir une présentation, le fichier a peut-être été supprimé par l’éditeur.

F I N

Plus de contenu associé

Transcription de la présentation
  1. Analyzing Categorical Data • Categorical Variables place individuals into one of several groups or categories • The values of a categorical variable are labels for the different categories • The distribution of a categorical variable lists the count or percent of individuals who fall into each category. Example, page 8 Variable Values Count Percent

  2. Analyzing Categorical Data • Displaying categorical data Frequency tables can be difficult to read. Sometimes is is easier to analyze a distribution by displaying it with a bar graph or pie chart.

  3. Graphs: Good and Bad Analyzing Categorical Data Bar graphs compare several quantities by comparing the heights of bars that represent those quantities. Our eyes react to the area of the bars as well as height. Be sure to make your bars equally wide. Avoid the temptation to replace the bars with pictures for greater appeal…this can be misleading! Alternate Example This ad for DIRECTV has multiple problems. How many can you point out?

  4. Analyzing Categorical Data • Two-Way Tables and Marginal Distributions When a dataset involves two categorical variables, we begin by examining the counts or percents in various categories for one of the variables. Definition: Two-way Table – describes two categorical variables, organizing counts according to a row variable and a column variable. Example, p. 12 What are the variables described by this two-way table? How many young adults were surveyed?

  5. Analyzing Categorical Data • Two-Way Tables and Marginal Distributions Definition: The Marginal Distribution of one of the categorical variables in a two-way table of counts is the distribution of values of that variable among all individuals described by the table. Note: Percents are often more informative than counts, especially when comparing groups of different sizes. To examine a marginal distribution, • Use the data in the table to calculate the marginal distribution (in percents) of the row or column totals. • Make a graph to display the marginal distribution.

  6. Analyzing Categorical Data • Two-Way Tables and Marginal Distributions Example, p. 13 Examine the marginal distribution of chance of getting rich.

  7. Analyzing Categorical Data • Relationships Between Categorical Variables • Marginal distributions tell us nothing about the relationship between two variables. Definition: A Conditional Distribution of a variable describes the values of that variable among individuals who have a specific value of another variable. To examine or compare conditional distributions, • Select the row(s) or column(s) of interest. • Use the data in the table to calculate the conditional distribution (in percents) of the row(s) or column(s). • Make a graph to display the conditional distribution. • Use a side-by-side bar graph or segmented bar graph to compare distributions.

  8. Analyzing Categorical Data • Two-Way Tables and Conditional Distributions Example, p. 15 Calculate the conditional distribution of opinion among males. Examine the relationship between gender and opinion.

  9. Analyzing Categorical Data • Organizing a Statistical Problem • As you learn more about statistics, you will be asked to solve more complex problems. • Here is a four-step process you can follow. How to Organize a Statistical Problem: A Four-Step Process State: What’s the question that you’re trying to answer? Plan: How will you go about answering the question? What statistical techniques does this problem call for? Do: Make graphs and carry out needed calculations. Conclude: Give your practical conclusion in the setting of the real-world problem.