Absorption Spectrometry
Absorption Spectrometry. Particularly UV-Visible. One difference between certain compounds is their colour. Quinone is yellow ; Chlorophyll is green ;


Absorption Spectrometry
E N D
Presentation Transcript
Absorption Spectrometry Particularly UV-Visible
One difference between certain compounds is their colour. • Quinone is yellow; • Chlorophyll is green; • 2,4-dinitrophenylhydrazone derivatives of aldehydes and ketones range in colour from bright yellow to deep red, depending on double bond conjugation; • Aspirin is colourless.
The human eye is functioning as a spectrometer analyzing the light reflected from the surface of a solid or passing through a liquid. • We see sunlight (or white light) as uniform or homogeneous in color, it is actually composed of a broad range of radiation wavelengths in the ultraviolet (UV), • visible and infrared (IR) portions • of the spectrum.
Absorption of 420-430 nm light renders a substance yellow, and absorption of 500-520 nm light makes it red. Green is unique in that it can be created by absorption close to 400 nm as well as absorption near 800 nm.
Wavelength is the distance between adjacent peaks (or troughs), in meters, centimeters or nanometers (10-9 meters). • Frequency is the number of wave cycles that travel past a fixed point per unit of time, and is usually in cycles per second, or hertz (Hz). • Visible wavelengths range from ~ 400 to 800 nm. The longest visible wavelength is red and the shortest is violet. Other common colors of the spectrum, in order of decreasing wavelength, may be remembered by the mnemonic: ROY G BIV.
The energy associated with a given segment of the spectrum is proportional to its frequency. The energy carried by a photon of a given wavelength of radiation: = h h = Planck’s constant = 6.6x10⁻³⁴ J.sec = c/ = frequency, = wavelength, c = speed of light = 3 x 10⁸ m/sec Frequency remains constant Wavelength and the speed of light change with the medium
Refractive index = c/v • medium n* • air 1.0003 • Water 1.333 • 50% sucrose in water 1.420 • carbon disulfide 1.628 • crystalline quartz 1.544 (no) • 1.553 (ne) • diamond 2.417
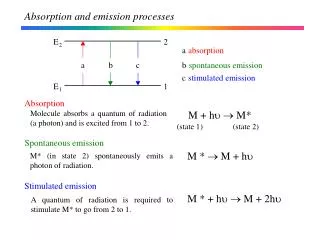
Each photon of light has a distinct energy • E = h • Causes transitions between quantized energy states in atoms, molecules etc. • Absorption • Emission • Scattering
Absorption Only if energy states differ by h Other frequencies pass through Measure decrease in P at each frequency
Emission • Chemical species can be excited by • Thermal • Chemical • Electrical energy. • If the subsequent relaxation to the ground state results in the release of light – • This is emission
Luminescence • When energy is absorbed the chemical species are excited. • The excited species will have a limited lifetime • They will relax – lose the excess energy- and return to the ground state. • If the excitation is by light and light is emitted upon relaxation – you have luminescence – fluorescence or phosphorescence. • Incoming beam is unidirectional, luminescence is emitted in all directions
Light passes more molecules when coming from the horizon – so some is scattered away and sky is very pale blue
WHY IS THE SUNSET RED? • As the sun sets, light must travel farther through the atmosphere before it gets to you. • More of the light is reflected and scattered. • As less reaches you directly, the sun appears less bright. The color of the sun appears to change, first to orange and then to red. This is because even more of the short wavelength blues and greens are now scattered. Only the longer wavelengths are left in the direct beam that reaches your eyes.
Mie Scattering For particle sizes larger than a wavelength, Mie scattering predominates. Mie scattering is not strongly wavelength dependent and produces the almost white glare around the sun when a lot of particulate material is present in the air. It also gives us the white light from mist and fog.
Tyndall effect When a very dilute dispersion of small particles or droplets is viewed directly against an illuminating light source it may appear to be transparent. In contrast, when the same dispersion is viewed from the side (at a right angle to the illuminating beam), and against a dark background, the dispersion may appear turbid and blue-white. The scattered light is due to Tyndall scattering and the optical effect is referred to as the Tyndall effect.
Raman Scattering • Like Rayleigh scattering, Raman scattering depends upon the polarizability of molecules. • The incident photon can excite vibrational modes of the molecules, yielding scattered photons which are diminished in energy by the amount of the vibrational transition energies. • Thus the scattered light is at lower energy than the incoming light. • Occurs with particles much smaller than wavelength of light
An application of Raman • The scattering produced by a laser beam directed on the plume from an industrial smokestack can be used to monitor the effluent for molecules which will produce recognizable Raman lines. • We will see some Raman scattering as an interference in our fluorescence spectra.
Turbidity is a critical water quality parameter • many applications, from drinking water to ultrapure processes.
Turbidimetry Standards – formazin (insoluble polymer) Turbidimeter- measures the amount of radiation that passes forward Nephelometer – measures scattered radiation (good if low turbidity) Some instruments use the ratio of these two measurements Turbidity is a critical water quality parameter in many applications, from drinking water to ultrapure processes.
Unsaturated functional groups that absorb UV or visible light are called chromophores • Single C-C bonds hold their electrons too tightly for transitions to occur. • But not so C-S, C-Br, C-I • The energy absorbed from the UV is comparable to some bond energies – some bonds can be broken – called photolysis
was used to color the robes of the royal and wealthy widely distributed in plants, but is not sufficiently stable to be used as permanent pigment, other than for food coloring A common feature of all these colored compounds, displayed below, is a system of extensively conjugated pi-electrons.
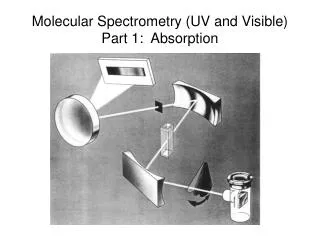
Absorption Analysis • Usually done on liquids, but gases can also be analyzed
Why are the bands so broad? • Within each electronic state there are numerous vibrational states. At room temperature, Molecule is in lowest vibrational state. • But it can excite into a variety of vibrational levels (and rotational levels within each) • In liquids additional broadening occurs because of collisions with the solvent which further reduce the lifetime of the excited state. (Short lifetime, broad peak – Heizenberg uncertainty principle)
Advantages of UV-visible absorption • Moderately low LOD • 10-7 to 10-6 M • Two types of applications: • Trace • Micro • Compared to gravimetric-rapid and convenient • Low cost • Can automate (increases instrument cost)
Absorption Only if energy states differ by h Other frequencies pass through Measure decrease in P at each frequency
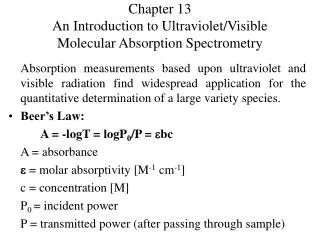
Beer-Lambert law • Extent of absorption depends on number of encounters between photons and absorbing species. • P0 = power of incident radiation • b = pathlength of cell
Percent Transmittance • A = log P0/P = -log T • A = log 1/T • %T = 100 T • Ranges from 0 to 100 % • A = log 100/%T
Deviations from Beer’s law • Instrumental • Non-monochromatic light • negative deviation at high conc. • Wide slits give lower A values • Stray light • a) Reflections • b) Higher orders • c) slit diffraction • All cause negative deviation
Real Deviations • Refractive index increases with concentration – at high concentrations there is a negative deviation • At concentrations > 0.01 M, each molecule affects the charge distribution of its neighbour • This can alter the ability of the molecules to absorb light. • Can also occur with high concs of surrounding electrolyte
Chemical Deviations Equilibria - acid base pH control Activity coef. Temperature Solvent effects
Analysis of two component sample If the components have absorptions that do not overlap, then measurement of each can be done independently of the other.
Analysis of two-component sample • Beer’s law is additive • The total absorbance will equal the sum of the absorbances • If two compounds, x and y, absorb at different enough wavelengths: • At 1, A1 = (Ax)1+ (Ay)1 = x1 [x] + y1[y] (assuming b=1cm) • At 2, A2 = (Ax)2+ (Ay)2 = x2 [x]+ y2 [y]
Determine the molar absorptivities () for x and y for each wavelength, 1 and2 • Then solve the simultaneous equations
If there is a lot of overlap between spectra • Am = xb[x] + yb[y] at any wavelength • Axs = xb[x]s • Ays = yb[y]s
The absorbances of the standards and mixtures are measured at a variety of wavelengths. The data at a particular wavelength will give one point on the graph. Thus measurements need to be done at at least 5 wavelengths