Download
1 / 38
380 likes | 516 Vues
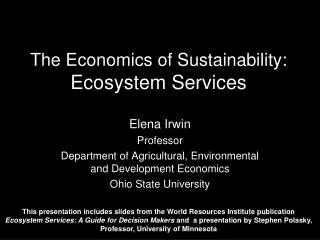
The Economics of Sustainability: Ecosystem Services. Elena Irwin Professor Department of Agricultural, Environmental and Development Economics Ohio State University.

E N D
The Economics of Sustainability: Ecosystem Services Elena Irwin Professor Department of Agricultural, Environmental and Development Economics Ohio State University This presentation includes slides from the World Resources Institute publication Ecosystem Services: A Guide for Decision Makers and a presentation by Stephen Polasky, Professor, University of Minnesota
3 cases from the field • New York City • Western China • Thailand What do they have in common?
Water quality in New York City • Ninety percent of NYC’s drinking water is drawn from sources in the Catskill Mountains and the headwaters of the Delaware River where it filters through nearly 1,600 square miles of watershed land • Early 1990s: Degradation of watershed threatened drinking water for 9 million people • Construction costs of a new water filtration plant estimated at $6 billion with $30 million annual operating expenses Ecosystem Services: A Guide for Decision Makers
Food production in China • 1950s: Shiyang River diverted to form the Hongyashan Reservoir (Minqin County) to support agriculture • River has dried up, no more reservoir, groundwater will be depleted in another 17 years • Desert is encroaching on Minqin at rate of 10 meters/year • Desertification costs China $2-3 billion each year Ecosystem Services: A Guide for Decision Makers
Shrimp farming in Thailand • Global shrimp production has grown at a rate of 10–20 percent per year in last 5-10 years • Shrimp aquaculture: low-cost shrimp • Mangroves (coastal wetlands that flood w brackish water) are ideal for aquaculture sites, but also provide habitat to native fish and storm protection • Productive life of a shrimp farm in Thailand is 5 years on average Ecosystem Services: A Guide for Decision Makers
What do these 3 cases have in common? • Changes were made to the management of ecosystems • These changes created unexpected costs to those dependent on nature’s services • Some gained from the changes, but many more lost • Most often, the economic gains are easy to see, but the ecological losses are “invisible” in the marketplace
What’s needed, why and how? • What: • Increased provision of ecosystem services and reduced human impacts on ecosystems • Why • To improve human well-being (become more sustainable) by increasing our total wealth • How • Account for the value of nature’s services • Provide the right incentives by developing markets for ecosystem services
Understand the link between ecosystems and human well-being Humans impact nature Nature impacts human well-being Ecosystem Services: A Guide for Decision Makers
A few definitions • A dynamic complex of plant, animal, and micro-organism communities and the non-living environment interacting as a functional unit Ecosystem • The benefits people obtain from ecosystems • The “services of nature” Ecosystem services • Physical assets generated by nature that provide ecosystem services Natural Capital Biodiversity • The variability among living organisms within species and populations, between species, and between ecosystems • Serves as the foundation for all ecosystem services
Millennium Ecosystem Assessment www.MAweb.org Largest assessment of the health of Earth’s ecosystems,, including trends, drivers, impacts and future scenarios Called for by UN Secretary General in 2000 Partnership of UN agencies, conventions, business, non-governmental organizations with a multi-stakeholder board of directors Prepared by 1360 experts from 95 countries Ecosystem Services: A Guide for Decision Makers
3 categories of ecosystem services Provisioning Goods produced or provided by ecosystems Cultural Non-material benefits obtained from ecosystems Regulating Benefits obtained from control of natural processes by ecosystems
What do we know about the status of the world’s ecosystem services? Degraded Mixed Enhanced Provisioning Capture fisheries Wild foods Biomass fuel Genetic resources Biochemicals Fresh water Air quality regulation Climate regulation Erosion regulation Water purification Pest regulation Pollination Natural hazard regulation Spiritual values Aesthetic values Timber Fiber Water regulation Disease regulation Recreation & ecotourism Crops Livestock Aquaculture Carbon sequestration Regulating What do these ecosystem services have in common? Cultural
What’s driving ecosystem change? Direct drivers • Physical changes that can be identified and monitored Indirect drivers • Alter the level or rate of change of one or more direct drivers Ecosystem Services: A Guide for Decision Makers
Direct drivers of ecosystem change • Habitat Change • Pollution • Climate change • Invasive Species • Overexploitation Ecosystem Services: A Guide for Decision Makers
Over- exploitation Boreal forest Temperate forest Tropical forest Temperate Grassland Mediterranean Tropical grassland and savanna Desert Inland water Coastal Marine Island Mountain Polar Trends in direct drivers Habitat change Climate change Invasive species Pollution Impact is incrasing Impact is at a constant rate Impact is decreasing
Indirect drivers of ecosystem change? • Demographic • Economic • Sociopolitical • Science and technologies • Cultural and religious Ecosystem Services: A Guide for Decision Makers
Trade-offs Tradeoffs Enhancement of some market-based ecosystem services often leads to degradation of others winners and losers Trade-offs occur because the same land area (or water body) produces both economic benefits and non-market ecosystem services that compete with (rather than complement) each other Synergies may be possible at a local scale However, at an aggregate level, there is a fundamental trade-off between economic growth and the environment
Why value nature? • TED talk: Pavan Sukhdev: Put a value on nature! • http://www.ted.com/talks/pavan_sukhdev_what_s_the_price_of_nature.html • The Economics of Ecosystems and Biodiversity (TEEB) Report, including the TEEB for Business report • Questions to think about as you watch this: • Why should society value ecosystem services? • Why should businesses value ecosystem services?
The main issues • Valuation: how can we assess the relative value (importance) of various ecosystem services? • Environmental economics: Methods to estimate the values of non-market ecosystem services to humans • Inclusive wealth accounting: National accounts that assess value of all forms of capital (produced, human, natural, social)
The main issues • Incentives: how can we provide rewards for providing ecosystem services? • Markets for ecosystem services, e.g., PES (payments for ecosystem services) = incentives for individuals and firms to provide ecosystem services • Markets for ecological damages = incentives for, e.g., carbon tax, cap-and-trade, impervious surface fee = individuals and firms to reduce impacts
Types of environmental values Use values refer to the utility arising from direct or indirect physical use of a resource including commercial use, recreational use, and aesthetic use: • Direct use values are private benefits that are derived from resource consumption and contribute to resource depletion. Examples are farming, forestry, fishing, grazing, hunting, mining. • Indirect use-values are generally public good benefits that do not contribute to resource depletion. Examples are swimming, boating, hiking, camping, viewing wildlife, observing scenic forests, mountains, rivers, waterfalls, etc. • Option value arises in situations where depleting a resource would be an irreversible action. It is derived from maintaining the option to utilize it in the future. For example, extinct plants could have medicinal value that can not be discovered anymore.
Types of environmental values • Non-use valuesrefer to utility that is derived from environmental resources without physical interaction with the resource: • Bequest valuerefers to utility derived from passing an environmental resource on to children and/or future generations. • Existence value, or inherent benefits refer to utility derived from the knowledge of the mere existence of environmental resources. You might never see many of the endangered species but you might still value their existence.
Total Economic Value = Direct Use Values + Indirect Use Values + Non-Use Values
Techniques for measuring the value of non-market goods The three major categories for measuring the value of non-market goods include: • Revealed preference techniques, which look at decisions people make in reaction to changes in environmental quality. • Stated preference techniques, which elicit values directly through survey methods. • Benefits-transferred techniques, which look at existing studies for value of analogous environmental change.
Techniques for measuring the value of non-market goods • Revealed preference = Market based methods (linking information from markets to environmental cost or demand) • Production function approach • Cost of illness approach • Cost-based approaches • Travel cost method • Hedonic pricing model • Stated preference = Non-market based methods (survey methods that elicit hypothetical values) • Contingent valuation • Conjoint analysis
Blue-green Algae Bloom circa 1970, Lake Erie Example: Lake Erie “I heard Lake Erie is the place fish go to die.” -- Johnny Carson, 1976
Research Questions • Do changes in the water quality of Lake Erie affect the value of houses in the region? • How important is water quality relative to other factors that influence housing values? • What is the estimated benefit (in dollars) of an improvement in water quality to homeowners?
Method: Hedonic Price Model • Sales price is decomposed into a series of “implicit prices” that represent the marginal contribution of each attribute to overall price • For example: Housing pricei = p1*(Sizei) + p2*(School qualityi) p3*(Access to worki) + p4*(Access to lakei) + p5*(Water qualityi) • Interpretation of pi = implicit price of X = the change in housing price given a marginal change in X • For example, p5 = the change in housing price given a an increase in water quality
Measuring Water Clarity: Secchi Disk Depth http://lakes.chebucto.org/DATA/PARAMETERS/SD/sd.html http://www.ecy.wa.gov/programs/wq/plants/management/joysmanual/secchi.html
Results: Mean Benefits to Homeowners from Improved Water Clarity Actual secchi disk depth mean for region = 221.3 cm
Providing incentives for ecosystem services and conservation • Demonstrating the value of ecosystem services is important: this can improve human decisions • BUT, valuation by itself does not guarantee better decisions: this depends on the incentives that the decision-maker is facing (their own benefits and costs) • Unless there is some form of reward for the provision of ecosystem services, the private landowner or firm may make a choice that generates too much environmental pollution or ecosystem destruction
Payments for ecosystem services (PES) • PES = benefit (cash or other) provided to purchase one or more ecosystem services or products • Effective markets require secure property rights, sufficient demand and supply, access to information for all stakeholders, established legal institutions. • Markets for ecosystem services are based on these principles of a well-functioning market • Sellers are landowners that provide clean air, clean water, wildlife habitat by sustainably managing their forests, wetlands, grasslands. • Buyers of these goods and services are power plants, water treatment facilities, developers, and others who invest in conservation Ecosystem Services: A Guide for Decision Makers
The problem of incentivesExample: pasture versus forest Conversion to pasture Forest conservation Benefits to private landowner Profits from livestock Profits from forest Reduced H2O services Problem: costs > benefits, and forest conservation not profitable ! Costs to downstream populationand others Loss of biodiversity Carbon emissions Source: Engel, Pagiola & Wunder, 2008
The logic of PES Conversion to pasture Forest conservationwith ES payments Benefits to private landowner Payments Min. payment Profits from livestock Profits from forest Payment for service Reduced H2O services Costs to downstream populationand others Max. payment Loss of biodiversity Carbon emissions Source: Engel, Pagiola & Wunder, 2008
Distribution of PES schemes in 2007 In total 145 PES schemes, 15 with unclear status (excluded in graph) Source: adapted from USAID 2007, PES Sourcebook
New York City negotiated a combination of land acquisition and management agreements with other landholders to protect the watershed at a total cost of $1.5 billion, • The payment for the natural water purification services also provides carbon storage and recreational and cultural services at no additional cost. Ecosystem Services: A Guide for Decision Makers
Elena Irwin Professor Department of Agricultural, Environmental and Development Economics Ohio State University irwin.78@osu.edu Ecosystem Services: A Guide for Decision Makers