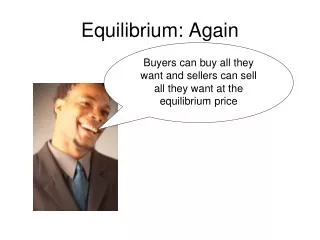
Equilibrium: Again
Equilibrium: Again. Buyers can buy all they want and sellers can sell all they want at the equilibrium price. Price per Bottle. California White Wine. S. Surplus. A. B. $13.00. $11.00. Є. $9.00. H. G. Shortage. D. Bottles per week. 0. 3,500. 4,500. 5,500.

Equilibrium: Again
E N D
Presentation Transcript
Equilibrium: Again Buyers can buy all they want and sellers can sell all they want at the equilibrium price
Price per Bottle California White Wine S Surplus A B $13.00 $11.00 Є $9.00 H G Shortage D Bottles per week 0 3,500 4,500 5,500
Increase in the price of white wine substitutes (red wine, scotch, beer . . .), ceteris paribus Price per Bottle S $13.00 $11.00 D2 D1 Bottles per week 0 4,500 5,500
Resource Allocation Keep in mind that as the equilibrium price and quantity of white wine increases, a greater share of scarce resources will be allocated to the production of white wine—leaving fewer resources for everything else
Increase in the price of white wine complements (lobster, turkey . . .), ceteris paribus Price per Bottle S $11.00 $9.00 D1 D0 Bottles per week 0 3,500 4,500
Increase in the consumer incomes, ceteris paribus Price per Bottle S $11.00 $9.00 D1 D0 Bottles per week 0 3,500 4,500
Increase in the price of white grapes, ceteris paribus Price per Bottle S0 S1 $13.00 $11.00 D1 Bottles per week 0 3,500 4,500
S 1990 S 2001 B A D 2001 D 1990 Price per Hour Simultaneous Shifts of Supply and Demand P 2001 P 1990 Hours of Day Care Q Q 1990 2001 a a
Effect of Supply and Demand Shifts on Equilibrium Price and Quantity
Price Floors and Ceilings “Legal restrictions on market price” • Price ceiling: The highest price at which it is legal to trade a particular good, service, or factor of production.Examples: Rent controls in NYC; Usury ceilings in Arkansas; ceilings on grain storage fees in Illinois. • Price floors: The lowest price at which it is legal to trade a particular good, service, or factor of production • Examples: Dept. of Agriculture loan rates for corn, soybeans, cotton, rice, peanuts, . . . ;The minimum wage.
The rental housing market in New York City Monthly Rent S If the Rent Control Board sets a ceiling of $900 per month, 3,000 apartment-seekers won’t be able to find one. $1,120 $900 Shortage D Rental Units 0 4,000 5,700 7,000
Does the minimum wage create unemployment? Wage rate (dollars per hour) S unemployment $5.15 D 0 3 7 Quantity (thousands of workers)
I believe increasing the minimum wage will cause unemployment among the unskilled and less-educated to rise
A price floor in the market for wheat A price floor of $3.20 per bushel willproduce a surplusof 300 bushels.But what ifthe floor were set at $2.35? #2 Hard KC Wheat P/BU S Surplus $3.20 $2.52 D 550 700 850 bushels 0