Understanding Statistical Inference and Hypothesis Testing for Proportions and Means
This chapter delves into statistical inference and hypothesis testing, focusing on one-sample, two-sample, and multiple-sample scenarios regarding means, variances, and proportions. It introduces concepts such as binary response variables, null and alternative hypotheses, and tests of homogeneity and independence. Key examples demonstrate the significance of associations in population preferences, such as the liking of foods. Statistical methods like the Z-test are used to draw conclusions from sample data, assisting in decision-making based on population parameters.

Understanding Statistical Inference and Hypothesis Testing for Proportions and Means
E N D
Presentation Transcript
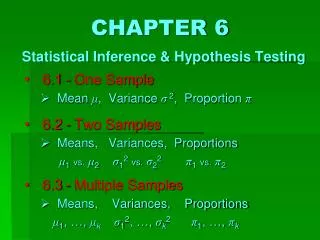
CHAPTER 6Statistical Inference & Hypothesis Testing 6.1 - One Sample Mean μ, Variance σ2, Proportion π 6.2 - Two Samples Means, Variances, Proportions μ1vs.μ2σ12vs.σ22π1vs.π2 6.3 - Multiple Samples Means, Variances, Proportions μ1, …, μkσ12, …,σk2π1, …, πk
CHAPTER 6Statistical Inference & Hypothesis Testing 6.1 - One Sample Mean μ, Variance σ2, Proportion π 6.2 - Two Samples Means, Variances, Proportions μ1vs.μ2σ12vs.σ22π1vs.π2 6.3 - Multiple Samples Means, Variances, Proportions μ1, …, μkσ12, …,σk2π1, …, πk
Binary Response: P(Success) = “Test of Homogeneity” POPULATION TWO POPULATIONS Two random binary variables I and J Random binary variable I I = 1 I = 0 “Do you like olives?” “Do you like Brussel sprouts?” = P(Yes to Brussel sprouts) Null Hypothesis H0: 1=2 “No difference in liking Brussel sprouts between two pops.” Alternative Hypothesis HA: 1 ≠ 2 “There is a difference in liking Brussel sprouts bet two pops.”
Binary Response: P(Success) = “Test of Homogeneity” POPULATION TWO POPULATIONS Two random binary variables I and J Random binary variable I J = 1 J = 0 “Do you like anchovies?” “Do you like Brussel sprouts?” = P(Yes to Brussel sprouts) Null Hypothesis H0: 1=2 “No difference in liking Brussel sprouts between two pops.” Alternative Hypothesis HA: 1 ≠ 2 “There is a difference in liking Brussel sprouts bet two pops.”
Binary Response: P(Success) = “Test of Independence” “Test of Homogeneity” POPULATION TWO POPULATIONS Two random binary variables I and J Random binary variable I I = 1 I = 0 J = 1 J = 0 “Do you like olives?” “Do you like anchovies?” “Do you like Brussel sprouts?” 2 = P(Yes to olives, given No to anchovies) 1 = P(Yes to olives, given Yes to anchovies) = P(Yes to Brussel sprouts) Null Hypothesis H0: 1=2 “No association exists between liking olives and anchovies.” Null Hypothesis H0: 1=2 “No difference in liking Brussel sprouts between two pops.” Alternative Hypothesis HA: 1 ≠ 2 “An association exists between liking olives and anchovies.” Alternative Hypothesis HA: 1 ≠ 2 “There is a difference in liking Brussel sprouts bet two pops.”
Binary Response: P(Success) = “Test of Independence” “Test of Homogeneity” POPULATION TWO POPULATIONS Two random binary variables I and J Random binary variable I I = 1 I = 0 J = 1 J = 0 “Do you like olives?” “Do you like anchovies?” “Do you like Brussel sprouts?” 2 = P(Yes to olives, given No to anchovies) 1 = P(Yes to olives, given Yes to anchovies) = P(Yes to Brussel sprouts) Sample, size n1 Sample, size n2 Sample, size n1 Sample, size n2 (Assume “large” sample sizes.)
Sample 1, size n1 Sample 2, size n2 X1 = # Successes X2 = # Successes Sampling Distribution of Problem:s.e. depends on !! Recall… Ifn 15 and n (1 – ) 15, then via the Normal Approximation to the Binomial… Solution: Use Ifn 15 and n (1 – ) 15, then via the Normal Approximation to the Binomial…
Sample 1, size n1 Sample 2, size n2 X1 = # Successes X2 = # Successes Ifn22 15 and n2 (1 – 2) 15, then via Normal Approximation to the Binomial Ifn11 15 and n1 (1 – 1) 15, then via Normal Approximation to the Binomial Sampling Distribution of Recall from section 4.1 (Discrete Models): Mean(X – Y) = Mean(X) – Mean(Y) and if X and Y are independent… Var(X – Y) = Var(X) + Var(Y)
Sample 1, size n1 Sample 2, size n2 X1 = # Successes X2 = # Successes “Null Distribution” standard error Similar problem as “one proportion” inference s.e.! = 0 under H0 Sampling Distribution of • For confidence interval, replace 1 and 2 respectively, by • For critical regionand p-value, replace 1 and 2 respectively, by….. ???? Null Hypothesis H0: 1=2 standard error estimate …so replace their common value by a “pooled” estimate. 0
Example: Two Proportions (of “Success”) • Study Question: “Is there an association between liking Bruce Willis movies and gender, or not?”
Example: Two Proportions (of “Success”) • Study Question: “Is there an association between liking Bruce Willis movies and gender, or not?” Test of Homogeneity (between two populations) Test of Homogeneity or Independence? • Design: Randomly select two large samples of males and females, and record their binary responses (Yes = 1, No = 0) to the question “Do you like Bruce Willis movies?” • Let the discrete random variableX = “# Successes” (i.e., “Yes” responses) in each gender of the samples, and use these data to test… • Null Hypothesis H0: P(“Yes” among Males) = P(“Yes” among Females), i.e., • Analysis via Z-test: Point estimates π1– π2 = 0, H0: π1= π2where π = P(Success) in each gender population. “No association exists.” • Data: Sample 1)n1 = 60 males, X1 = 42 Sample 2)n2 = 40 females, X2 = 16 NOTE: This is > 0. Therefore, REJECT H0 Conclusion: A significant association exists at the .05 level between “liking Bruce Willis movies” and gender, with males showing a 30% preference over females, on average.
Example: Two Proportions (of “Success”) • Study Question: “Is there an association between liking Bruce Willis movies and gender, or not?” Test of Homogeneity or Independence • Design: Randomly select two large samples of males and females, and record their binary responses (Yes = 1, No = 0) to the question “Do you like Bruce Willis movies?” • Let the discrete random variableX = “# Successes” (i.e., “Yes” responses) in each gender of the samples, and use these data to test… • Null Hypothesis H0: P(“Yes” among Males) = P(“Yes” among Females), i.e., • Analysis via Z-test: Point estimates π1– π2 = 0, H0: π1= π2where π = P(Success) in each gender population. “No association exists.” • Data: Sample 1)n1 = 60 males, X1 = 42 Sample 2)n2 = 40 females, X2 = 16 NOTE: This is > 0. Therefore, REJECT H0 Conclusion: A significant association exists at the .05 level; “liking Bruce Willis movies” and gender are dependent, with males showing a 30% preference over females, on average.
Binary Response: P(Success) = “Test of Independence” “Test of Homogeneity” POPULATION TWO POPULATIONS Two random binary variables I and J Random binary variable I I = 1 I = 0 J = 1 Males Females J = 0 “Do you like olives?” “Do you like anchovies?” “Do you like Bruce Willis movies?” 2 = P(Yes to olives, given No to anchovies) 1 = P(Yes to olives, given Yes to anchovies) = P(Yes to Bruce Willis movies) Null Hypothesis H0: 1=2 “No association exists between liking olives and anchovies.” Null Hypothesis H0: 1=2 “No difference in liking Bruce Willis between two pops.” Alternative Hypothesis HA: 1 ≠ 2 “An association exists between liking olives and anchovies.” Alternative Hypothesis HA: 1 ≠ 2 “There is a difference in liking Bruce Willis bet two pops.”
Binary Response: P(Success) = “Test of Independence” “Test of Homogeneity” POPULATION TWO POPULATIONS Two random binary variables I and J Random binary variable I I = 1 I = 0 J = 1 Males Females J = 0 “Do you like olives?” “Do you like Bruce Willis?” “Gender: Male?” “Do you like anchovies?” “Do you like Bruce Willis movies?” 2 = P(Yes to Bruce, given No to Male = Female) 1 = P(Yes to Bruce, given Yes to Male) = P(Yes to Bruce Willis movies) Null Hypothesis H0: 1=2 “No association exists between liking Bruce and gender.” Null Hypothesis H0: 1=2 “No difference in liking Bruce Willis between two pops.” Alternative Hypothesis HA: 1 ≠ 2 “An association exists between liking Bruce and gender.” Alternative Hypothesis HA: 1 ≠ 2 “There is a difference in liking Bruce Willis bet two pops.”
Example: Two Proportions (of “Success”) • Study Question: “Is there an association between liking Bruce Willis movies and gender, or not?” • Design: Randomly select two large samples of males and females, and record their binary responses (Yes = 1, No = 0) to the question “Do you like Bruce Willis movies?” • Let the discrete random variableX = “# Successes” (i.e., “Yes” responses) in each gender of the samples, and use these data to test… • Null Hypothesis H0: P(“Yes” among Males) = P(“Yes” among Females), i.e., π1– π2 = 0, H0: π1= π2where π = P(Success) in each gender population. “No association exists.” • Data: Sample 1)n1 = 60 males, X1 = 42 Sample 2)n2 = 40 females, X2 = 16 ~ ALTERNATE METHOD ~ I = 1 I = 0 J = 1 J = 0
Example: Two Proportions (of “Success”) • Study Question: “Is there an association between liking Bruce Willis movies and gender, or not?” • Design: Randomly select two large samples of males and females, and record their binary responses (Yes = 1, No = 0) to the question “Do you like Bruce Willis movies?” • Let the discrete random variableX = “# Successes” (i.e., “Yes” responses) in each gender of the samples, and use these data to test… • Null Hypothesis H0: P(“Yes” among Males) = P(“Yes” among Females), i.e., π1– π2 = 0, H0: π1= π2where π = P(Success) in each gender population. “No association exists.” • Data: Sample 1)n1 = 60 males, X1 = 42 Sample 2)n2 = 40 females, X2 = 16 Observed Expected (under H0)
Recall Probability Tables from Chapter 3…. Under the null hypothesis, the binary variable I is statistically independent of the binary variable J, i.e., P(I∩ J) = P(I)P(J).
Recall Probability Tables from Chapter 3…. Under the null hypothesis, the binary variable I is statistically independent of the binary variable J, e.g., P(“I = 1” ∩ “J = 1”) = P(“I = 1”)P(“J = 1”). Contingency Table Probability Table Therefore… , etc.
Example: Two Proportions (of “Success”) • Study Question: “Is there an association between liking Bruce Willis movies and gender, or not?” • Design: Randomly select two large samples of males and females, and record their binary responses (Yes = 1, No = 0) to the question “Do you like Bruce Willis movies?” • Let the discrete random variableX = “# Successes” (i.e., “Yes” responses) in each gender of the samples, and use these data to test… • Null Hypothesis H0: P(“Yes” among Males) = P(“Yes” among Females), i.e., π1– π2 = 0, H0: π1= π2where π = P(Success) in each gender population. “No association exists.” • Data: Sample 1)n1 = 60 males, X1 = 42 Sample 2)n2 = 40 females, X2 = 16 Observed “Chi-squared” Test Statistic Expected (under H0) Check: Is the null hypothesis true? 23.2 34.8 where “degrees of freedom” df = (# rows – 1)(# cols – 1), = 1 for a 2 2 table. 25.2 16.8
Example: Two Proportions (of “Success”) • Study Question: “Is there an association between liking Bruce Willis movies and gender, or not?” • Design: Randomly select two large samples of males and females, and record their binary responses (Yes = 1, No = 0) to the question “Do you like Bruce Willis movies?” Expected (under H0) Observed “Chi-squared” Test Statistic p = ????? = 8.867 on 1 df
Because 8.867 is much greater than the α=.05 critical value of 3.841, it follows that p << .05. More precisely, 7.879 < 8.867 < 9.141; hence .0025 < p < .005. α=.05 Yes = c(42, 16) No = c(18, 24) Bruce = rbind(Yes, No) chisq.test(Bruce, correct = F) The actual p-value = .0029, the same as that found using the Z-test! Pearson's Chi-squared test data: Bruce X-squared = 8.867, df = 1, p-value = 0.002904
Example: Two Proportions (of “Success”) • Study Question: “Is there an association between liking Bruce Willis movies and gender, or not?” • Design: Randomly select two large samples of males and females, and record their binary responses (Yes = 1, No = 0) to the question “Do you like Bruce Willis movies?” Expected (under H0) Observed “Chi-squared” Test Statistic The α=.05 critical value is 3.841. p = .0029 Recall… = 8.867 on 1 df
Example: Two Proportions (of “Success”) • Study Question: “Is there an association between liking Bruce Willis movies and gender, or not?” • Design: Randomly select two large samples of males and females, and record their binary responses (Yes = 1, No = 0) to the question “Do you like Bruce Willis movies?” • Let the discrete random variableX = “# Successes” (i.e., “Yes” responses) in each gender of the samples, and use these data to test… • Null Hypothesis H0: P(“Yes” in Male population) = P(“Yes” in Female population), i.e., • Analysis via Z-test: Point estimates π1– π2 = 0, H0: π1= π2where π = P(Success) in each gender population. “No association exists.” • Data: Sample 1)n1 = 60 males, X1 = 42 Sample 2)n2 = 40 females, X2 = 16 NOTE: This is > 0. Therefore, REJECT H0 Conclusion: A significant association exists at the .05 level; “liking Bruce Willis movies” and gender are dependent, with males showing a 30% preference over females, on average.
Example: Two Proportions (of “Success”) • Study Question: “Is there an association between liking Bruce Willis movies and gender, or not?” • Design: Randomly select two large samples of males and females, and record their binary responses (Yes = 1, No = 0) to the question “Do you like Bruce Willis movies?” Expected (under H0) Observed “Chi-squared” Test Statistic The α=.05 critical value is 3.841. p = .0029 = 8.867 on 1 df NOTE:(Z-score)2 = (2.9775)2 = 8.867 on 1 df NOTE:(Z-score)2 = (2.9775)2 Connection between Z-test and Chi-squared test ! Connection between Z-test and Chi-squared test !
“Chi-squared” Test Statistic for Categorical Data “degrees of freedom” df = (# rows – 1)(# cols – 1) • 2 2 Chi-squared Test is only valid if: • Null Hypothesis H0: 1 – 2 = 0. One-sided or nonzero null value Z-test! • Expected Values 5, in order to avoid “spurious significance” due to a possibly inflated Chi-squared value. • Paired version of 2 2 Chi-squared Test = McNemar Test • Categorical data – contingency table with any number of rows and columns • Formal Null Hypothesis difficult to write mathematically in terms of 1, 2,… • “Test of Independence” “Test of Homogeneity” • Informal H0: “No association exists between rows and columns.” • 80% of Expected Values 5 • See notes for other details, comments, including “Goodness-of-Fit” Test.