Download
1 / 11
110 likes | 135 Vues
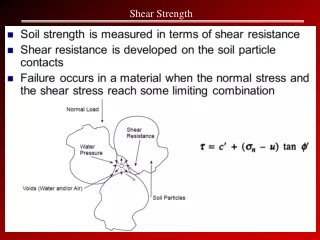
Construction of any civil engineering structural project whether it is building, bridge, dam or road etc is done on or below the surface of earth. The main purposes of any structure is to transmit the load to the soil beneath, so the soil beneath should be strong enough to bear the upcoming loads without undergoing any failure. Construction of any structure over a weak soil is highly difficult and unsafe as the soil undergoes differential settlements due to high compressibility and poor shear strength. Hence it is most important for us to check the engineering properties of soil before construction.Sub grade is the underlying soil that supports the applied wheel load .If the sub grade of the soil is too weak to support the wheel loads, the pavement will flex excessively which ultimately causes the pavement to fail.The current study deals with the enhancement of shearing strength of soil which is one of the most engineering property of soil using cement as an additive to reduce sub grade failure.Therefore the present study gives an idea for improving the geotechnical engineering properties of the soil used for the pavement sub grade by using the additive which have mixed into the soil to get the desired improvement to fulfill the strength criteria. This criteria can be applied to the roads and air fields having a much stabilized surface layer. This can be achieved by mixing the sandy soil and Ordinary Portland Cement with the water and compacting the mix to get a stronger composite materialTherefore, the present investigation describes the behavioral aspect of soils mixed with 0 , 5 , 10 and 15 cement by volume of soil to improve the load bearing capacity of the soil. Shear strength and index properties such as water content, MDD, OMC, etc. were determine and analyzed for the purpose of enhancement of pavement sub grade.The resultant material becomes hard and durable structural material as cement get hydrated and gained strength by adding 5 , 10 and 15 of the cement by volume with the sandy soil. Compaction test was applied to determine the maximum dry density and the optimum moisture content of the soil by adding 5 ,10 and 15 of cement, in this the dry density first increases at 5 and 10 .The bearing capacity of any soil usually increases with increasing dry density and decreasing moisture content. The shear strength also increases, because increase in cementing content causes increase in shear strength by 13.75 , 19.19 and 9.4 respectively with respect to soil containing 0 of cement. High density assures high shear strength and greater imperviousness .Overall we can say that soil stabilization for pavement sub grade using cement as additive is a good ground improvement technique especially in engineering projects on weak soils. the geotechnical engineering properties of the soil used for the pavement sub grade by using the additive which have mixed into the soil to get the desired improvement to fulfill the strength criteria. This criteria can be applied to the roads and air fields having a much stabilized surface layer. This can be achieved by mixing the sandy soil and Ordinary Portland Cement with the water and compacting the mix to get a stronger composite materialTherefore, the present investigation describes the behavioral aspect of soils mixed with 0 , 5 , 10 and 15 cement by volume of soil to improve the load bearing capacity of the soil. Shear strength and index properties such as water content, MDD, OMC, Liquid limit, specific gravity etc. were determine and analyzed for the purpose of enhancement of pavement sub grade.The resultant material becomes hard and durable structural material as cement get hydrated and gained strength by adding 5 , 10 and 15 of the cement by volume with the sandy soil. Compaction test was applied to determine the maximum dry density and the optimum moisture content of the soil by adding 5 ,10 and 15 of cement, in this the dry density first increases at 5 and 10 .The bearing capacity of any soil usually increases with increasing dry density and decreasing moisture content. The shear strength also increases, because increase in cementing content causes increase in shear strength by 13.75 , 19.19 and 9.4 respectively with respect to soil containing 0 of cement. High density assures high shear strength and greater imperviousness .Overall we can say that soil stabilization for pavement sub grade using cement as additive is a good ground improvement technique especially in engineering projects on weak soils. Ausif Hussain Dangroo | Deepak Dalal "An Experimental Study on Shear Strength of Soil Subgrade using Cement as Stabilizing Agent" Published in International Journal of Trend in Scientific Research and Development (ijtsrd), ISSN: 2456-6470, Volume-2 | Issue-3 , April 2018, URL: https://www.ijtsrd.com/papers/ijtsrd12704.pdf Paper URL: http://www.ijtsrd.com/engineering/civil-engineering/12704/an-experimental-study-on-shear-strength-of-soil-subgrade-using-cement-as-stabilizing-agent/ausif-hussain-dangroo<br>

E N D
International Research Research and Development (IJTSRD) International Open Access Journal An Experimental Study on Shear Strength f Soil Subgrade using Cement as Stabilizing Agent International Journal of Trend in Scientific Scientific (IJTSRD) International Open Access Journal ISSN No: 2456 ISSN No: 2456 - 6470 | www.ijtsrd.com | Volume www.ijtsrd.com | Volume - 2 | Issue – 3 An Experimental Study of Soil Subgrade n Shear Strength s Stabilizing Agent Ausif Hussain Dangroo versity, Mandi Gobindgrah, Punjab Deepak Dal Desh Bhagat University, Mandi Gobindgrah, Punjab Dalal Desh Bhagat University, Mandi Gobindgrah, Punjab Assistant Professor, Desh Bhagat University, Mandi Gobindgrah, Punjab Traditionally and widely accepted types of soil stabilization techniques use products such as bitumen emulsions which can be used as a producing a road base. However, bitumen is not environmentally friendly and becomes brittle when it dries out. Portland cement has been used as an alternative to soil stabilization. However, this can often be expensive and is not a very alternative. Scope of Study The scope is to improving the engineering properties of soils used for pavement base courses, sub base courses, and sub grades by the use of additives which are mixed into the soil to effect the desired improvement. These criteria are also applicable to roads and airfields having a stabilized surface layer. As we know Soil-cement highly of soil, Portland cement, and water. As the cement reacts, or hydrates, the mixture gains strength and improves the engineering properties of the raw soil. Its improved strength and durability, combined with its low first cost and ease of construction, make soil cement an outstanding value for use as a base and sub base material. Its improved strength and durability, combined with its low first cost and ease of construction, make soil-cement an outstanding value for use as a base and sub base material. The soil material in soil-cement can be almost any combination of sand, silt, clay, shell, gravel, or crushed stone. Soil-cement is often more economical to construct than granular bases through the use of soil material on or near the commercial paving site. soil material on or near the commercial paving site. INTRODUCTION General Soil stabilization is the process of altering some soil properties by different methods, mechanical or chemical in order to produce an improved soil material which has all the desired engineering properties. Soils are generally stabilized to increase their strength and durability or to prevent erosion and dust formation in soils. The main aim is the creation of a soil material or system that will hold under the design use conditions and for the designed life of the engineering project. The properties of soi great deal at different places or in certain cases even at one place; the success of soil stabilization depends on soil testing. Various methods are employed to stabilize soil and the method should be verified in the lab with the soil material before applying it on the field. The objective of soil stabilization is to improve the California Bearing Ratio of in-situ soils by 4 to 6 times. The other prime objective of soil stabilization is to improve on-site materials to create a solid and strong sub-base and base courses. In certain regions of the world, typically developing countries and now more frequently in developed countries, soil stabilization stabilization is to improve on materials to create a solid and strong sub base courses. In certain regions of the world, typically developing countries and now more frequently in developed countries, soil stabilization is being used to construct the entire road. In the past, soil stabilization was done by utilizing the binding properties of clay soils, cement products such as soil cement utilizing the "rammed earth" technique (compaction) and lime. Soil stabilization is the process of altering some soil properties by different methods, mechanical or chemical in order to produce an improved soil material which has all the desired engineering properties. Soils are generally stabilized to increase strength and durability or to prevent erosion and dust formation in soils. The main aim is the creation of a soil material or system that will hold under the design use conditions and for the designed life of the engineering project. The properties of soil vary a great deal at different places or in certain cases even at one place; the success of soil stabilization depends on soil testing. Various methods are employed to stabilize soil and the method should be verified in the Traditionally and widely accepted types of soil stabilization techniques use products such as bitumen emulsions which can be used as a binding agents for producing a road base. However, bitumen is not environmentally friendly and becomes brittle when it dries out. Portland cement has been used as an alternative to soil stabilization. However, this can often be expensive and is not a very good "green" The scope is to improving the engineering properties of soils used for pavement base courses, sub base courses, and sub grades by the use of additives which are mixed into the soil to effect the desired nt. These criteria are also applicable to roads and airfields having a stabilized surface layer. cement highly-compacted mixture of soil, Portland cement, and water. As the cement reacts, or hydrates, the mixture gains strength and the engineering properties of the raw soil. Its improved strength and durability, combined with its low first cost and ease of construction, make soil- cement an outstanding value for use as a base and sub base material. Its improved strength and y, combined with its low first cost and ease ore applying it on the field. The objective of soil stabilization is to improve situ soils by 4 to 6 times. The other prime objective of soil stabilization site materials to create a solid and base and base courses. In certain regions of the world, typically developing countries and now more frequently in developed countries, soil stabilization stabilization is to improve on-site materials to create a solid and strong sub-base and In certain regions of the world, typically developing countries and now more frequently in developed countries, soil stabilization is being used to construct the entire road. cement an outstanding value for use as a base and sub base material. The cement can be almost any combination of sand, silt, clay, shell, gravel, or cement is often more economical to construct than granular bases through the use of In the past, soil stabilization was done by utilizing clay soils, cement-based products such as soil cement utilizing the "rammed earth" technique (compaction) and lime. @ IJTSRD | Available Online @ www.ijtsrd.com @ IJTSRD | Available Online @ www.ijtsrd.com | Volume – 2 | Issue – 3 | Mar-Apr 2018 Apr 2018 Page: 2251
International Journal of Trend in Scientific Research and Development (IJTSRD) ISSN: 2456-6470 Modern methods and equipment make soil-cement processing simple and efficient. soils are processed at the paving site. When borrow soil is used, it is usually mixed in a central plant at the borrow source, then hauled to the paving site to be compacted, finished to grade, and cured. There is no mellowing period or other delays in the construction process. In addition, soil-cement is stable immediately after construction and gains strength rapidly. Making good soil-cement out of old flexible pavement is nothing new; it has been done for years. Failed flexible pavements contain materials that can be salvaged economically by recycling – breaking them up, pulverizing them, and stabilizing them with a minimum quantity of Portland cement to make a new soil-cement base. There is no disposal problem as is commonly found when old pavements are dug out. Since approximately 90% of the material used is already in place, handling and hauling costs are cut to a minimum. Many granular and waste materials from quarries and gravel pits can also be used to make soil-cement, thus conserving high-grade materials for other purposes. Soil-cement is often more economical to construct than granular bases through the use of soil material on or near the commercial paving site. Generally, any in-place nonorganic, low plasticity soils can be used. Also, nearby granular borrow soil can provide an excellent material source, requiring lower cement contents than clay and silt soils. Borrow soils do not have to be expensive base-course material; almost any granular material is suitable. EXPERIMENTAL INVESTIGATIONS Scope of work The experimental work comprises in the following parts: 1. Particle size distribution by sieve analysis 2. Determination of the maximum dry density (MDD) and the corresponding optimum moisture content (OMC) of the soil by Proctor compaction test. 1. Grain size distribution by sieve analysis:- Test for the grain size distribution is carried out by sieve analysis by using a set of standard sieves The panicle size distribution of soils can be performed by two methods, i.e. sieve analysis and hydro-meter analysis. If more than 50% of the soil sample passes through 75micron, then the particle size analysis is done by hydro-meter method but if the percentage of the particles retained on the 75micron is more than the percentile of the particles passing through it, therefore the panicle size distribution is determined by sieve analysis. The size distribution curves, as obtained from coarse and fine grained portions, can be combined to form one complete grain-size distribution curve (also known as grading curve). A typical grading curve is shown. Grading curve From the complete grain-size distribution curve, useful information can be obtained such as: 1)Grading characteristics, which indicate the uniformity and range in grain-sizedistribution. @ IJTSRD | Available Online @ www.ijtsrd.com | Volume – 2 | Issue – 3 | Mar-Apr 2018 Page: 2252
International Journal of Trend in Scientific Research and Development (IJTSRD) ISSN: 2456-6470 2). Percentages (or fractions) of gravel, sand, silt and clay-size A grading curve is a useful aid to soil description. The geometric properties of a grading curve are called grading characteristics. Grading Characteristics To obtain the grading characteristics, three points are located first on the grading curve for calculating Cc and Cu. The following panicle classification names are given depending on the size of the particles: • Boulders: Particle size is more than 300mm. • Cobble: Particles size range 80mm to 300mm, • Gravel: Particles size in range 4.75 to 80mm • Coarse Gravel: 20mm to 80mm. • Fine Gravel: 4.75mm to 20mm • Sand: Particles size in range 0.075mm to 4.75mm. • Coarse sand: 2.0 mm to 4 .75mm. • Medium Sand: 0.075mm to 0.425mm. • Fine Sand: 0.075mm to o.425mm. Soils having Less than 50% particles of size smaller than 0.075mm are designated by the symbols as: Poorly Graded Gravel (GP). Well Graded Gravel. (OW) Well Graded Sand. (SW) Poorly Graded Sand (SP) For sand Gravels and sands may be either poorly graded (uniformly graded) or well graded depending on the value of coefficient of curvature and uniformity coefficient. Coefficient of curvature (Cc) may be estimated as: Cc = Coefficient of curvature should lie between 1 and 3 for well grade gravel and sand. Uniformity coefficient (Cu) is given by: Cu = ??? Its value should be more than 4 for well graded gravel and more than 6 for well graded sand. Where, D60 = Particle size at 60%finer. D30 = Particle size at 30% finer. D10 = Particle size at 10 % finer. ???? ??? × ??? ???. GW( well graded Sand) Having Cc= 1 to 3 and Cu > 6 GP(poorly graded sand) If it does not show the above two values i.e Cc and Cu. When it lies below the Attenberg’s Line and having plasticity Index (Ip < 4 ) When it lies above the Attenberg’s line and having plasticity index (Ip>7) GM (Silty sand ) GC (clayey sand ) @ IJTSRD | Available Online @ www.ijtsrd.com | Volume – 2 | Issue – 3 | Mar-Apr 2018 Page: 2253
International Journal of Trend in Scientific Research and Development (IJTSRD) ISSN: 2456-6470 For gravel GW( well graded gravel) Having Cc= 1 to 3 and Cu >4 GP(poorly graded gravel) If it does not show the above two values i.e. Cc and Cu. GM (Silty gravel ) When it lies below the Attenberg’s Line and having plasticity Index (Ip < 4 ) When it lies above the Attenberg’s line and having plasticity index (Ip>7) GC (clayey gravel) analysis can be used to predict soil water movement although permeability tests are more generally used. The size distribution is often of critical importance to the way the material performs in use. A sieve analysis can be performed on any type of non- organic or organic granular materials including sands, crushed rock, clays, granite, feldspars, coal, and soil, a wide range of manufactured powders, grain and seeds, down to a minimum size depending on Ac exact method. Being such a simple technique of particle sizing, it is probably the most common. The grain sizes analysis is an attempt to determine the relative properties of the different grain sizes that makeup the soil sample. And also measurement of the proportion of the various primary soil particles as determined usually either by their capacities to pass through sieves of various mesh size or by rates of settling in water. The grain size analysis or particle size analysis is widely used in classification of soils. The data obtained from grain size distribution curve, is used in the design of filters earth dams and to determine suitability of soil for road construction, air field etc. Information obtained from grain size OBSERVATION AND CALCULATION TABLE: Mass of soil Sample taken for Analysis = 500 g. Sieve Analysis Sieve size Mass of soil retained (X) 4.75 mm 0 % retained Y1=X / M 0 of soil Cumulative % of soil retained (%) P1=Y1,P2=Y1+Y2 0 % Finer =(100 –P) 100 % 2 mm 22 g 4.42 4.42 95.58 600 (micron) 38 g 7.63 12.05 87.95 425 (micron) 20 g 4.02 16.07 83.93 300 (micron) 13 g 2.60 18.67 81.33 180(micron) 146 g 29.31 47.98 52.02 75(micron) 206 g 41.36 89.34 10.66 Pan 53g 10.64 99.98 0.02 @ IJTSRD | Available Online @ www.ijtsrd.com | Volume – 2 | Issue – 3 | Mar-Apr 2018 Page: 2254
International Journal of Trend in Scientific Research and Development (IJTSRD) ISSN: 2456-6470 120% 100% 100% 95.58% 87.95% 83.93% 81.33% 80% % finner D60 60% 52.03% sieve graph D30 40% D10 20% 10.66% 0% 0.02% 10 1 sieve sizein mm The laboratory testing is meant to establish the maximum dry density that can be attained for a given soil with a standard amount of compactive effort. In the test, the dry density cannot be determined directly, and as such the bulk density and the moisture content are obtained first to calculate the dry density as ??= Where ?= bulk density, and w = water content. A series of samples of the soil are compacted at different water contents, and a curve is drawn with axes of dry density and water content. The resulting plot usually has a distinct peak as shown. Such inverted “V” curves are obtained for cohesive soils (or soils with fines), and are known as compaction curves. 2. Determination of the maximum dry density (MDD) and the corresponding optimum moisture content (OMC) of the soil by Proctor compaction test. In the construction of highway embankments, airports, earth. Dams and other engineering structures, the compaction of soils is needed to improve its increase i.e. to increase the unit weight. Compaction increases the strength characteristics soils, which increases the bearing capacity of the foundation constructed over them. Compaction also decreases the amount of the undesirable settlement of structures and increases the stability of slopes of the embankments. Therefore improvement of the mechanical properties of the soil. To assesses the degree of compaction, it is necessary to use the dry unit weight, which is an indicator of compactness of solid soil particles in a given volume. ? ??? it is the artificial @ IJTSRD | Available Online @ www.ijtsrd.com | Volume – 2 | Issue – 3 | Mar-Apr 2018 Page: 2255
International Journal of Trend in Scientific Research and Development (IJTSRD) ISSN: 2456-6470 mixed with varying amounts of water and then compacted in three layers (light compaction) or five layers (heavy compaction) by the hammer that delivers 56 blows to each layer. The hammer has a mass of 2.5 kg and has a drop of 30.5cm For each test, the moisture content of the compacted soil is determined in the laboratory. With the known moisture content, the dry unit weight can be calculated as: Ɣd = ɣb/ (1+w %) Where W (%) = percentage of moisture content. Ɣd =dry density of the sample. Ɣb = bulk density of the sample. The value of yd determined from the above equation can be plotted against to the corresponding moisture contents to obtain the maximum dry unit weight and the optimum moisture content for the soil. For the given moisture content (w) and the degree of saturation S, the dry unit weight of the compaction can be calculated as follows: Ɣd =Gs. ɣw/ (1-e) Where Gs = Specific gravity of the soil. Ɣw = unit weight of water. e = void ratio Observations and Calculations: 1. Diameter of mould, d (cm) = 15cm 2.Height of mould, h (cm) = 12.73cm 3.Volume of mould, V (cm3) = 2250 cm^3 4.Mass of mould, W (g) = 5.710 kg 5. Wt. of rammer (kg) = 2.5kg 6. No. of layers = 3 7. No.of blows/layer =56 8. height of rammer=31cm Dry density related to water content and degree of saturation In 1993 Proctor developed a laboratory compaction test to determine the maximum dry density of compacted soils. In the compaction process the air content in the soil is reduced, decreasing the soil porosity as result of the soil densification (increase in the unit weight of the soil) without losing humidity. Therefore the resistance of the soil, the deformation capacity and permeability of the soil get affected resulting in inalterability against the external agents. These characteristics are modified due to the diminution of the void ratio produced by the soil densification. For coarse and fine-grained soils, average values are 8 to 15 and 17 to 36 respectively. Optimum moisture content is the moisture content that results in greatest density for specified compactive effort. The soil compacted at water contents higher than the optimum water content results in a relatively dispersed soil structure that is weaker, more ductile, less pervious, softer, more susceptible to shrinking, and less susceptible to swelling than soil compacted dry of optimum to the same density. The soil compacted lower than the optimum water content typically results in a flocculated soil structure that has the opposite characteristics of the soil compacted wet of the optimum water content to the same density. At OMC, the soil is broadly 90% saturated depending upon type of soil, meaning that about 10% of the void space is occupied by air. In the proctor test, the soil is compacted in a mould that has a volume of 2248.43 cm3. The diameter and height of the mould is 15cm and 12.73cm respectively. The mould is attached to a base plate at the bottom and to an extension at the top. The soil is MMD & OMC of Sample 1 (Soil) Sample no. 1 2 3 4 % of Water added Ww 13% 16% 19% 22% Weight of mould + compacted soil(g) 9946 10114 9958 9880 Weight of compacted soil W 4236 4404 4248 4170 @ IJTSRD | Available Online @ www.ijtsrd.com | Volume – 2 | Issue – 3 | Mar-Apr 2018 Page: 2256
International Journal of Trend in Scientific Research and Development (IJTSRD) ISSN: 2456-6470 1.88 1.95 1.87 1.85 Bulk density = ? ? ?? ?????(g/cc) Dry density= 1.59 1.68 1.61 1.51 ???? ??????? ??? Water content Container no. A B C D Weight of wet soil W1 86g 70g 66g 66g Weight of dry soil W2 77g 60g 56g 55g 12 16 18 20 Water content ? = ????? x100 ?? 1.7 Max Dry Density 1.68 1.68 1.66 1.64 1.62 Dry density 1.61 1.6 1.59 water content vs dry density 1.58 1.56 1.54 1.52 OMC 1.51 1.5 0 5 10 15 20 25 water content Graph for sample 1(soil) MMD & OMC of Sample 2 by Adding 5% of cement. In this we take 5 kg sample (I e 4.75 kg of soil + .25 kg of cement) 1 2 3 4 Sample no. 13% 16% 19% 22% % of Water added Ww 10146 11104 10102 9942 Weight of mould + compacted soil(g) 4026 4486 4438 4260 Weight of compacted soil W 1.78 1.99 1.97 1.89 Bulk density = ? ? ?? ?????(g/cc) @ IJTSRD | Available Online @ www.ijtsrd.com | Volume – 2 | Issue – 3 | Mar-Apr 2018 Page: 2257
International Journal of Trend in Scientific Research and Development (IJTSRD) ISSN: 2456-6470 1.57 1.70 1.66 1.54 Dry density=???? ??????? ??? Water content A B C D Container no. 88g 74g 68g 69g Weight of wet soil W1 76g 62g 56g 54g Weight of dry soil W2 16 19 21 28 Water content ? =????? 100 x ?? MAX DRY DENSITY 1.72 1.71 1.7 1.68 1.66 1.66 DRY DENSITY 1.64 1.62 dry density 1.6 MMD &OMC GRAPG 1.58 1.57 1.56 1.54 1.54 OMC 1.52 0 5 10 15 20 25 30 WATER CONTENT Graph for sample 2 by adding 5 % of cement. MMD and OMC of Sample 3 by Adding 10 % of cement . In this we take 5 kg sample that is 4.5 kg of soil + .5 kg of cement 1 2 3 4 Sample no. 13% 16% 19% 22% % of Water added Ww 10056 10146 9986 9880 Weight of mould + compacted sample Weight of compacted sample W Bulk density = ? ? ?? ?????(g/cc) Dry density=???? ??????? 4346 4436 4276 4170 1.93 1.97 1.90 1.85 1.70 1.71 1.60 1.51 ??? @ IJTSRD | Available Online @ www.ijtsrd.com | Volume – 2 | Issue – 3 | Mar-Apr 2018 Page: 2258
International Journal of Trend in Scientific Research and Development (IJTSRD) ISSN: 2456-6470 Water content A B C D Container no. 76g 56g 50g 53g Weight of wet soil W1 68g 49g 43g 44g Weight of dry soil W2 11.76 14.28 16.27 20.45 Water content ? =????? 100 x ?? Max dry density 1.75 1.71 1.7 1.7 1.65 Dry density 1.6 1.6 dry density vs water content 1.55 1.51 1.5 OMC 1.45 0 5 10 15 20 25 Water content Graph for sample 3 by adding 10 % of cement . MMD & OMC of Sample 4 by Adding 15% of cement . In this we take 5 kg sample (ie 4.25 kg of soil + .75 kg of cement) 1 2 3 4 Sample no. 13% 16% 19% 22% % of Water added Ww 10256 11126 10112 9802 Weight of mould + compacted sample Weight of compacted sample W Bulk density = ? ? ?? ?????(g/cc) 3498 3648 3504 3401 1.55 1.62 1.55 1.52 1.37 1.39 1.30 1.24 Dry density=???? ??????? ??? @ IJTSRD | Available Online @ www.ijtsrd.com | Volume – 2 | Issue – 3 | Mar-Apr 2018 Page: 2259
International Journal of Trend in Scientific Research and Development (IJTSRD) ISSN: 2456-6470 Water content A B C D Container no. 77g 58g 54g 51g Weight of wet soil W1 68g 49g 44g 40g Weight of dry soil W2 13.23 18.36 22.72 27.5 Water content ? =????? 100 x ?? MDD 1.4 1.39 1.38 1.37 1.36 DRY DENSITY 1.34 1.32 1.3 1.3 DRY DENSITY MDD AND OMC GRAPH 1.28 1.26 1.24 1.24 OMC 1.22 0 5 10 15 20 25 30 WATER CONTENT Graph for sample 4 by adding 15 % of cement Max Dry Density vs. OMC Result Sample 1 (soil) Sample2 (soil + cement) At 5% Sample3 (soil + cement) At 10% Sample4 cement) At 15% (soil + Max dry density Optimum moisture content Among the four soil samples being tested for the maximum dry density and the optimum moisture content. The sample 4 has the highest optimum moisture content but less maximum dry density and Samples 3 (soil +cement) has high maximum dry density but low moisture content. 1.68 g/cc 16% 1.70 g/cc 18% 1.71 g/cc 14.5% 1.39g/cc 18.5 @ IJTSRD | Available Online @ www.ijtsrd.com | Volume – 2 | Issue – 3 | Mar-Apr 2018 Page: 2260
International Journal of Trend in Scientific Research and Development (IJTSRD) ISSN: 2456-6470 CONCLUSION 1.From Graphical representation of Sieve analysis (Fig 3.8) the coefficient of curvature (Cc) is found to be 1 and the coefficient of uniformity (Cu) is 4. Based on the Cc and Cu we can conclude that the soil samples are sandy soil, consisting of sandy particles and some gravel. 2.Among the four soil samples being tested for the maximum dry density and the optimum moisture content, from the (Fig 3.20) and (Fig 3.13) it shows that the dry density and the optimum moisture content first increases when adding 5% and 10% cement, then it goes on decreasing after adding 15 % of cement to the soil due to shrinkage .The bearing capacity of any soil usually increases with increasing dry density and decreasing moisture content. High density assures high shear strength imperviousness. and greater @ IJTSRD | Available Online @ www.ijtsrd.com | Volume – 2 | Issue – 3 | Mar-Apr 2018 Page: 2261