Download
1 / 15
150 likes | 166 Vues
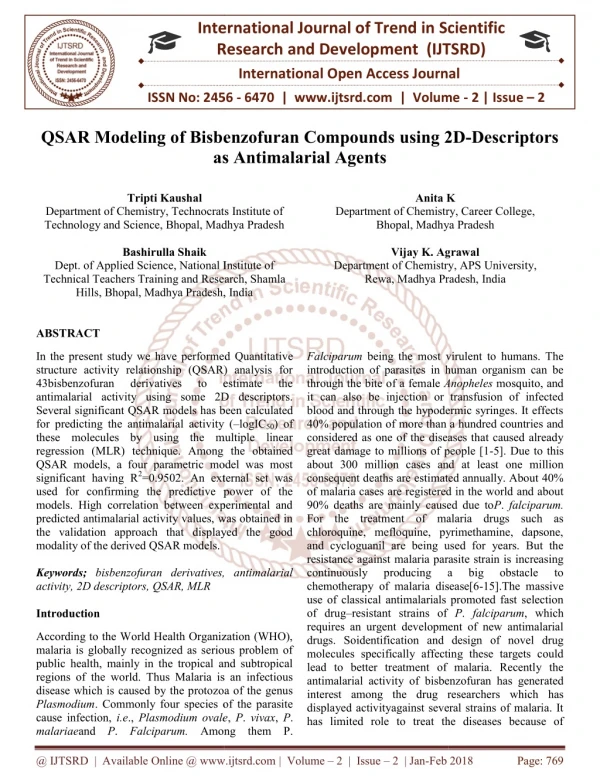
In the present study we have performed Quantitative structure activity relationship QSAR analysis for 43bisbenzofuran derivatives to estimate the antimalarial activity using some 2D descriptors. Several significant QSAR models has been calculated for predicting the antimalarial activity logIC50 of these molecules by using the multiple linear regression MLR technique. Among the obtained QSAR models, a four parametric model was most significant having R2=0.9502. An external set was used for confirming the predictive power of the models. High correlation between experimental and predicted antimalarial activity values, was obtained in the validation approach that displayed the good modality of the derived QSAR models. Tripti Kaushal | Anita K | Bashirulla Shaik | Vijay K. Agrawal "QSAR Modeling of Bisbenzofuran Compounds using 2D-Descriptors as Antimalarial Agents" Published in International Journal of Trend in Scientific Research and Development (ijtsrd), ISSN: 2456-6470, Volume-2 | Issue-2 , February 2018, URL: https://www.ijtsrd.com/papers/ijtsrd9497.pdf Paper URL: http://www.ijtsrd.com/chemistry/other/9497/qsar-modeling-of-bisbenzofuran-compounds-using-2d-descriptors-as-antimalarial-agents/tripti-kaushal<br>

E N D
International Research Research and Development (IJTSRD) International Open Access Journal f Bisbenzofuran Compounds using 2 s Antimalarial Agents International Journal of Trend in Scie Scientific (IJTSRD) International Open Access Journal ISSN No: 2456 ISSN No: 2456 - 6470 | www.ijtsrd.com | Volume 6470 | www.ijtsrd.com | Volume - 2 | Issue – 2 QSAR Modeling of Bisbenzofuran Compounds as Antimalarial Agents sing 2D-Descriptors Tripti Kaushal Anita K Anita K Department of Chemistry, Technocrats Institute of Technology and Science, Bhopal, Madhya Pradesh Technology and Science, Bhopal, Madhya Pradesh Department of Chemistry, Technocrats Institute of Department of Chemistry, Career College, Department of Chemistry, Career College, Bhopal, Madhya Pradesh pal, Madhya Pradesh Bashirulla Shaik Vijay K. Agrawal Vijay K. Agrawal of Chemistry, APS University, Rewa, Madhya Pradesh, India Dept. of Applied Science, National Institute of Technical Teachers Training and Research, Shamla Hills, Bhopal, Madhya Pradesh, India Hills, Bhopal, Madhya Pradesh, India Dept. of Applied Science, National Institute of Technical Teachers Training and Research, Shamla Department of Chemistry, APS University, Rewa, Madhya Pradesh, ABSTRACT In the present study we have performed structure activity relationship (QSAR) analysis for 43bisbenzofuran derivatives antimalarial activity using some 2D descriptors. Several significant QSAR models has bee for predicting the antimalarial activity ( these molecules by using the multiple linear regression (MLR) technique. Among the obtained QSAR models, a four parametric model was most significant having R2=0.9502. An external set was used for confirming the predictive power of the models. High correlation between experimental and predicted antimalarial activity values, was obtained in the validation approach that displayed the good modality of the derived QSAR models. Keywords; bisbenzofuran derivatives, antimalarial activity, 2D descriptors, QSAR, MLR Introduction In the present study we have performed Quantitative structure activity relationship (QSAR) analysis for 43bisbenzofuran derivatives Falciparum being the most virulent to humans. The introduction of parasites in human organism can be through the bite of a female Anopheles it can also be injection or transfusion of infected blood and through the hypodermic syringes. It effects 40% population of more than a hundred countries and considered as one of the diseases that caused already great damage to millions of people [1 about 300 million cases and at least one million consequent deaths are estimated annually. About 40% of malaria cases are registered in the world and about 90% deaths are mainly caused due to For the treatment of malaria drugs such as chloroquine, mefloquine, pyrimethamine, dapsone, and cycloguanil are being used for years. But the resistance against malaria parasite strain is increasing continuously producing chemotherapy of malaria disease[6 use of classical antimalarials promoted fast selection of drug–resistant strains of requires an urgent development of new antimalarial drugs. Soidentification and design of novel drug molecules specifically affecting these targets could lead to better treatment of malaria. Recently the antimalarial activity of bisbenzofuran has generated interest among the drug researchers which has displayed activityagainst several strains of malaria. It has limited role to treat the diseases because of has limited role to treat the diseases because of most virulent to humans. The introduction of parasites in human organism can be to to estimate estimate the the Anopheles mosquito, and some 2D descriptors. it can also be injection or transfusion of infected blood and through the hypodermic syringes. It effects f more than a hundred countries and considered as one of the diseases that caused already great damage to millions of people [1-5]. Due to this about 300 million cases and at least one million consequent deaths are estimated annually. About 40% cases are registered in the world and about 90% deaths are mainly caused due toP. falciparum. For the treatment of malaria drugs such as chloroquine, mefloquine, pyrimethamine, dapsone, and cycloguanil are being used for years. But the alaria parasite strain is increasing continuously producing chemotherapy of malaria disease[6-15].The massive use of classical antimalarials promoted fast selection resistant strains of P. falciparum, which lopment of new antimalarial identification and design of novel drug molecules specifically affecting these targets could lead to better treatment of malaria. Recently the bisbenzofuran has generated Several significant QSAR models has been calculated for predicting the antimalarial activity (–logIC50) of these molecules by using the multiple linear regression (MLR) technique. Among the obtained QSAR models, a four parametric model was most =0.9502. An external set was used for confirming the predictive power of the models. High correlation between experimental and predicted antimalarial activity values, was obtained in the validation approach that displayed the good zofuran derivatives, antimalarial a a big big obstacle obstacle to to According to the World Health Organization (WHO), malaria is globally recognized as serious problem of public health, mainly in the tropical and subtropical regions of the world. Thus Malaria is an infectious disease which is caused by the protozoa of the genus Plasmodium. Commonly four species of the parasite cause infection, i.e., Plasmodium ovale malariaeand P. Falciparum. Among them P According to the World Health Organization (WHO), malaria is globally recognized as serious problem of public health, mainly in the tropical and subtropical world. Thus Malaria is an infectious disease which is caused by the protozoa of the genus . Commonly four species of the parasite Plasmodium ovale, P. vivax, P. researchers which has displayed activityagainst several strains of malaria. It Among them P. @ IJTSRD | Available Online @ www.ijtsrd.com @ IJTSRD | Available Online @ www.ijtsrd.com | Volume – 2 | Issue – 2 | Jan-Feb 2018 Feb 2018 Page: 769
International Journal of Trend in Scientific Research and Development (IJTSRD) ISSN: 2456-6470 protonation of its amidine group at physiological pH, pentamidineand also shows low oral availability. Drugrequiresparentral administration which makes the treatment less practical in rural areas. Pentamidine is tolerated by most patients in spite of some reported serious adverse effects [16, 17, 18].In this context it is very appropriate to search for options to find a potent antimalarial compound with improved potency and oral availability. Computational chemistry is an important tool to rational drug design. The quantitative structure-activity relationship (QSAR) approach by Hansch et al. helps to correlate the specific biological activities of compounds with the molecular properties of the compounds. The authors have successfully reported use of topological parameters for modeling antimalarial activity of 4- pyridones against P. falciparum T9-96 strains[ 19]. Materials and Methods In the present work an attempt was made to find out a mathematical model which correlates the possible structural requirements and biological activity of in order to design of new and more potent compounds with strengthened biological activities. An analysis using the MLR method is applied to a series of 43bisbenzofurans derivatives with known biological activity[20].The biological activity has been given in terms of negative log of IC50 in order to convert the data into free energy change related values. Structural details of the compound having antimalarial activity (bisbenzofurancation) used in present studyare given in Table-1.The parameters used for modeling the activity are VE1_D, VE1_B(e), GATS7p, GATS8p , CATS2D_04_DA, CATS2D_06_PL, B10[N-N], F08[C-C], DLS_07 , Psychotic-80 and cRo5. Here DLS_07 , Psychotic-80 , cRo5 are Drug-like CATS2D_04_DA, CATS2D_06_PL, F08[C-C] are 2D Atom Pairs parameters, GATS7p, GATS8p are 2D- autocorrelation parameters [21]and VE1_D, VE1_B(e) are 2D matrix-based descriptors. All these have been calculated using DRAGON software[22] and for regression purpose NCSS was used [23]. The calculated values along with biological activity –log IC50are given inTable-2.The entire data set given in table 1 has been divided into training and test set and efforts have been made for obtaining the best suitable model for modeling the -log IC50 value. We have taken 31 compounds for training set and 12 compounds as test set. The generation of training and test sets is done on random basis. For statistical validation, variety of statistical parameters was calculated. correlation models for the training set have been reported below along with their statistical parameters. RESULT AND DISCUSSION: The correlation matrixes of these parameters arereportedin Table-3 which clearly reveals that F08[C-C] is highly correlated with VE1_D and similarly B10[N-N] is highly correlated with CATS2D_06_PL and Psychotic-80 is highly correlated F08[C-C]. Hence while dealing with these parameters the collinearity defect should be checked. Now, we will discuss the results obtained in successive regression analysis. It is pertinent to mention that the parameter which are auto-correlated should not be used in multiparametric analysis because they may result in to some defect in the model. Through variable selection four parameters were selected and the data presented in Table-2 was subjected to regression analysis which yields significant models. These models along with their quality are reported in Table-5. ONE-PARAMETRIC MODEL: Among all the models, the best one parametric model contains B10 [N-N], having R2 value equal to 0.8459. The model is as below: -logIC50=2.0051(±0.1589) B10[N-N]+0.1149 (4.1.1) N=31, Se = 0.1563, R2 = 0.8459, R2Adj= 0.8406, F- ratio = 159.185, Q =5.8830 Here and here after N is total number of compounds ; Se is the standard error of estimation;R2 is the square of correlation coefficient;R2Adj is the adjusted R2;F is the Fisher’s ratio and Q is the Pogliani’s quality factor[24] which is the ration of R/Se (Pogliani, 1994,1996) TWO-PARAMETRIC MODEL: When cRo5 is added to the mono-parametric model, two parametric models are resulted with improved R2 value. For this model R2 comes out to be 0.9211and R2Adj also enhances from0.8406 to 0.9154. The model is reported as under IC50=2.0531(±0.1161) B10[N-N]-0.2881(±0.0558) cRo5+0.3550 N=31 , Se = 0.1138, R2 = 0.9211, R2Adj=0.9154, F- ratio = 163.392 , Q =8.4292 All these statistically significant indices descriptors, B10[N-N], (2) @ IJTSRD | Available Online @ www.ijtsrd.com | Volume – 2 | Issue – 2 | Jan-Feb 2018 Page: 770
International Journal of Trend in Scientific Research and Development (IJTSRD) ISSN: 2456-6470 than SSY (sum of squares of response value) indicates that the model predicts better than the chance and can be considered statically significant. In our study, the value of PRESS is much lower than SSY indicating that all the models obtained are statically significant. The ration of PRESS/SSY can be used to calculate approximate confidence intervals of prediction of new compounds. To be a reasonable and significant QSAR model, the ratio PRESS/SSY should be less than 0.4 (PRESS/SSY < 0.4) and the value of this ratio 0.1 indicates an excellent model. A close observation of Table-6 shows that except the one parametric model (model1, Table4)all other PRESS/SSY ratio more or less or nearer to 0.1 indicating thereby all the proposed models are having best predicting capacity. R2cv is the cross validation squared correlation coefficient. The highest R2cv values 0.948 for four parametric model [(Model-30 and Table-4);Fig.1] confirms our findings. The two important cross- validation parameters uncertainty in prediction (SPRESS) and predictive squared error (PSE) were also calculated. For this model, the value of SSY is highest, whereas, the values of PRESS, PRESS/SSY, SPRESS, and PSE have been lowest, conforming our findings. Final confirmation is obtained by calculating the estimated values of -log IC50 for the entire set of compounds using tetra parametric model and the same has been reported in Table-5.These values are in good agreement with the estimated value. Further confirmation is obtained by plotting a graph between observed and estimated -log IC50 values using four parametric model, the predictive power for the model comes out to be 0.9502, suggesting that 95 % variance in the data could be explained using this model. Therefore, this is the best model for modeling - iogIC50 values of the compound used in this study. The external predictive power of the model is assessed by predicting pIC50 value of the 9 test set molecules, which are not included in the QSAR model development. Further, VIF (variance inflation factor), Eigen values (λi), condition number (k), tolerance (T) for all the independent parameters have been calculated or all the independent parameters used in the proposed models and they are reported in Table-7.The collinearity is observed if the value of VIF is greater than 10. In the table all the combination have VIF less THREE-PARAMETRIC MODEL: F08[C-C] has also been found to be an effective parameter in modeling log IC50. When higher parametric models were tried with B10_N_N_, F08[C-C]as correlating parameters along with VE1_D in modeling the antimalarial activity, a improvement in the quality of the model is observed. For this model, R2 comes out to be 0.9318.The value of R2Adj changes from 0.9154 to 0.9242 suggesting that the added parameter is favorable .The model is given below: IC50=2.1541(±0.1176) B10_N_N_+0.0241(±0.0044) F08[C-C]-0.5575(±0.1052) VE1_D+2.2910 (3) N= 31, Se = 0.1078, R2= 0.9318, R2Adj= 0.9242, F- ratio = 122.890, Q =8.9532 FOUR -PARAMETRIC MODEL: Finally, by adding parametersGATS7p atetra - parametric model having R2=0.9502 is found to be the best model for modeling IC50 activity. The model contains B10 [N-N], F08[C- C], GATS7p and VE1_D as correlating parameter. The lowest values of SE and also highest value of F- ratio and Q-value further confirm our results. Addition of GATS7p is justified as R2Adj changes from 0.9242 to 0.9425. The model is found as under: IC50= 1.9399 (±0.1235) (±0.0041) F08[C-C]-0.9062(±0.2920) GATS7p -0.5498(±0.0916) VE1_D+3.3488 (4) N=31, Se =0.0939, R2 =0.9502, R2Adj= 0.9425, F-ratio =124.031, Q =10.3859 A close look at this model revels that out of four parameters contained, two (GATS7p, VE1_D) are having negative coefficients, while two of them are positive (B10 [N-N], F08[C-C]). The predictive potential of the model has been obtained by plotting a graph between observed and estimated activity values and such graph is demonstrated in Fig. 1. PREDICTIVE POWER BASED ON CROSS VALIDATION: Leave –one –out cross (leave –one –out) validation procedure”(Chaterjeeet al .,2000) is being widely used to examine the suitability of predictive power of the model[25]. The obtained results are reported in Table-6 .As stated earlier the predicted residual sum of square (PRESS) is the most important cross- validation parameter accounting for good estimate of the real predictive error of the model. Its value less models have the 2D- autocorrelation B10[N-N]+0.0197 @ IJTSRD | Available Online @ www.ijtsrd.com | Volume – 2 | Issue – 2 | Jan-Feb 2018 Page: 771
International Journal of Trend in Scientific Research and Development (IJTSRD) ISSN: 2456-6470 than 10 means all the proposed models are free from collinearity. And if λi, (Eigen value) is found to be greater than 5 then the model will suffer from collinearity. Here all the models have λi value less than 5 so all the models are free from the defect of collinearity. Condition number is another test forcollinearity if its value is found to be >100 then the collinearity exists but results indicate that values always <100 likewise. . Tolerance value equal to 1 or less indicates absence of collinearity Table-7 indicates that all the above mentioned parameters or models discussed in the study are free from multi-collinearity. The ridge traces are recorded in fig.-2 and fig.-3 respectively. Table 1 Structures of bisbenzofurancation used in the present study CONCLUSION: 1. Positive coefficient of B10[N-N] suggests that presence/absence of N - N at topological distance 10 plays a dominant role in deciding the antimalarial activity of present set of compounds. 2. The coefficient of both the GATS7p and VE1_D parameters are negative. Therefore molecules having higher value of polarizability and topological distance matrix should be avoided in designing synthesizing new compounds for better activity. Compounds with low value of these parameters will certainly give better activity. 1 2 3 NH2 H N H N N H H N N H NH O NH2 O O O O O H N H N H N H N 4 5 6 N H H N N O O H2 N N H NH O O O O H N NH H N N H2 N N H 7 8 9 NH O NH H2 N H O O O N O H N O N H N N NH NH NH H2 N 10 11 12 N H N O H N O O N H H2 N O H N O O N H N H N H2 N NH N H 13 14 15 O O N O N H N H O N H O O N H H N N N H2 H N N H N H2 N H @ IJTSRD | Available Online @ www.ijtsrd.com | Volume – 2 | Issue – 2 | Jan-Feb 2018 Page: 772
International Journal of Trend in Scientific Research and Development (IJTSRD) ISSN: 2456-6470 16 17 18 O H N O H2 N O O O NH N O H N NH H N NH N NH H N NH2 19 20 21 O N O O N H O NH H N O NH O N H N H NH2 NH2 NH2 N H N H 22 23 24 N H H2 N NH NH H N O H N N H2 NH O O O N N O O NH NH 25 26 27 H N H N N H N H2 N NH N NH O N H NH O NH2 O O NH O O 28 29 30 N H NH N H2 N NH N H N H NH N O N H2 NH O O N H O O O 31 32 33 N H2 N H H N N N H H N H N N H N N H2 N H N H O O O O O O O O O O 34 35 36 @ IJTSRD | Available Online @ www.ijtsrd.com | Volume – 2 | Issue – 2 | Jan-Feb 2018 Page: 773
International Journal of Trend in Scientific Research and Development (IJTSRD) ISSN: 2456-6470 H N H N N H N NH H2 N N N H NH O NH O O O O NH O NH2 O O 37 38 39 N H2 N H2 N H N H N N H H2 N H2 N N N H N H O O N H O O O O 40 41 42 N H2 N H N H2 2 H N H N H N H N H2 N H2 N 2 N H N H N H O O O O O O 43 N H 2 H N H N 2 N H O O @ IJTSRD | Available Online @ www.ijtsrd.com | Volume – 2 | Issue – 2 | Jan-Feb 2018 Page: 774
International Journal of Trend in Scientific Research and Development (IJTSRD) ISSN: 2456-6470 Table -2 values of the calculated descriptors along with their activity values S. IC50 VE1_D VE1_B GATS7p GATS8p CATS2D CATS2D B10 F08 DLS_07 Psychotic- cRo5 No. (e) _04_DA _06_PL [N-N] [C-C] 80 0.068 4.617 4.07 0.978 1.078 2 2 0 10 1 1 1 1* 0.918 5.084 4.05 1.13 1.092 0 0 1 21 1 1 1 2* 2.12 4.647 3.939 0.917 1.14 0 3 1 11 1 1 1 3 0.028 4.541 3.844 1.087 1.054 0 0 0 11 1 1 1 4* 0.102 4.987 3.941 1.047 1.102 0 0 0 20 1 1 1 5 0.034 4.843 3.789 1.14 0.98 0 0 0 17 1 1 1 6 0.022 4.294 3.641 1.127 1.032 0 0 0 12 1 1 1 7 0.003 5.131 3.844 0.987 1.064 0 0 0 18 0.5 1 1 8* 0.003 5.045 3.962 1.044 1.153 0 0 0 22 1 0 1 9 0.011 4.908 3.909 1.115 1.028 0 0 0 19 1 1 1 10 0.002 4.599 3.892 1.144 1.223 0 1 0 13 1 1 1 11 0.006 5.038 3.99 1.082 1.087 0 0 0 22 1 0 1 12 0.046 4.894 3.935 1.071 1.09 0 0 0 19 1 1 1 13 0.004 4.599 3.728 1.236 1.176 0 2 0 13 1 1 1 14 0.005 5.038 3.817 1.104 0.96 0 0 0 24 1 0 1 15 0.034 4.908 3.761 1.012 1.161 0 0 0 19 1 1 1 16 17* 0.041 4.714 3.873 1.109 1.118 0 0 0 16 1 1 1 18* 0.009 5.109 3.97 1.071 1.135 0 0 0 25 1 0 1 19* 0.004 4.866 3.873 1.224 1.081 0 1 0 18 1 1 1 0.037 4.683 3.736 1.256 1.142 0 2 0 16 1 1 1 20 21* 0.036 5.095 3.825 1.127 0.969 0 0 0 27 1 0 1 0.353 4.958 3.784 1.006 1.194 0 0 0 22 1 1 1 22 23* 0.032 4.817 3.877 1.145 1.15 0 0 0 20 1 1 1 0.01 5.182 3.974 1.097 1.157 0 0 0 29 1 0 1 24 0.026 5.062 3.922 1.168 1.057 0 0 0 26 1 1 1 25 26* 0.058 4.779 3.74 1.282 1.171 0 2 0 20 1 1 1 0.076 5.159 3.829 1.152 1.004 0 0 0 31 1 0 1 27 28* 0.164 5.031 3.788 1.043 1.213 0 0 0 26 1 1 1 0.067 4.926 3.878 1.087 1.181 0 0 0 23 1 1 1 29 0.02 5.266 3.976 1.063 1.18 0 0 0 32 0.5 0 1 30 0.067 5.156 3.923 1.118 1.088 0 0 0 29 1 0 1 31 0.066 5.329 3.861 1.06 1.043 0 0 0 29 0.5 1 1 32 33* 0.133 5.661 3.945 1.025 1.129 0 0 0 42 0.5 0 1 0.11 5.56 3.9 1.041 1.161 0 0 0 35 1 0 1 34 @ IJTSRD | Available Online @ www.ijtsrd.com | Volume – 2 | Issue – 2 | Jan-Feb 2018 Page: 775
International Journal of Trend in Scientific Research and Development (IJTSRD) ISSN: 2456-6470 0.057 4.888 3.741 1.214 1.202 0 2 0 23 1 1 1 35 0.018 5.233 3.83 1.115 1.037 0 0 0 34 0.5 0 1 36 0.133 5.116 3.789 0.998 1.237 0 0 0 29 1 0 1 37 0.364 4.989 3.879 1.056 1.125 0 0 0 26 1 1 1 38 0.279 4.822 3.879 1.049 1.093 0 0 0 27 1 0 0 39 0.694 4.419 3.879 1.042 1.084 0 0 0 28 1 0 0 40 0.296 4.674 3.879 1.037 1.076 0 0 0 29 0.5 0 0 41 0.287 4.952 3.879 1.032 1.069 0 0 0 30 0.5 0 0 42 0.219 5.146 3.879 1.028 1.063 0 0 0 31 0.5 0 0 43 VE1_D =coefficient sum of the last eigenvector from topological distance matrix (2D matrix-based descriptors) VE1_B(e)= coefficient sum of the last eigenvector from Burden matrix weighted by Sanderson electronegativity( 2D matrix-based descriptors) GATS7p =Geary autocorrelation of lag 7 weighted by polarizability (2D autocorrelations) GATS8p =Geary autocorrelation of lag 8 weighted by polarizability (2D autocorrelations) CATS2D_04_DA= CATS2D Donor-Acceptor at lag 04 (CATS 2D) CATS2D_06_PL= CATS2D Positive-Lipophilic at lag 06 CATS (2D Atom Pairs) B10[N-N] =Presence/absence of N - N at topological distance 10 (2D Atom Pairs) F08[C-C] =Frequency of C - C at topological distance 8 (2D Atom Pairs) DLS_07= modified drug-like score from Veber et al. (2 rules)( Drug-like indices) Psychotic-80= Ghose-Viswanadhan-Wendoloski antipsychotic-like index at 80% (Drug-like indices) cRo5 =Complementary Lipinski Alert index (Drug-like indices) Table 4.1.3 Correlation matrix IC50 VE1_D VE1_B(e) GATS7p GATS8p CATS2D_ B10 06_PL [N-N] IC50 1 VE1_D -0.290 1 VE1_B(e) 0.166 0.424 1 GATS7p -0.561 -0.170 -0.402 1 GATS8p 0.084 -0.014 0.026 -0.111 1 CATS2D_06_PL 0.512 -0.403 -0.251 0.261 0.360 1 B10[N-N] 0.920 -0.206 0.170 -0.432 0.085 0.628 1 F08[C-C] -0.214 0.718 0.329 -0.218 -0.123 -0.557 -0.356 DLS_07 0.036 -0.285 -0.131 0.205 0.204 0.203 0.089 Psychotic-80 0.079 -0.394 -0.356 0.257 0.147 0.401 0.177 cRo5 -0.200 0.237 -0.090 0.296 0.189 0.182 0.080 @ IJTSRD | Available Online @ www.ijtsrd.com | Volume – 2 | Issue – 2 | Jan-Feb 2018 Page: 776
International Journal of Trend in Scientific Research and Development (IJTSRD) ISSN: 2456-6470 F08[C-C] DLS_07 Psychotic-80 cRo5 F08[C-C] 1 DLS_07 -0.517 1 Psychotic-80 -0.723 0.343 1 cRo5 -0.341 0.451 0.453 1 Table 4 Regression Parameters and Quality of Correlation R2 R2Adj Model Parameters Ai = (1-----4) B SE F-ratio Q=R/SE no Used DLS_07 0.0710 (±0.3618) 0.1155 0.3980 0.0013 0.0000 0.038 0.0906 01 Psychotic_80 0.0609 (±0.1427) 0.1482 0.3970 0.0062 0.0000 0.182 0.1983 02 GATS8p 0.4605 (±1.0130) -0.3303 0.3968 0.0071 0.0000 0.207 0.2123 03 VE1_B_e_ 0.7731 (±0.8536) -2.8061 0.3927 0.0275 0.000 0.820 0.4223 04 cRo5 -0.2091(±0.1906) 0.3550 0.3902 0.0399 0.0068 1.204 0.5119 05 F08[C-C] -0.0125(±0.0106) 0.4773 0.3891 0.0456 0.0127 1.386 0.5489 06 VE1_D -0.4217(±0.2582) 2.2654 0.3811 0.0842 0.0526 2.667 0.7614 07 CATS2D_06_PL 0.2536 (±0.0789) 0.0978 0.3420 0.2626 0.2372 10.327 1.4985 08 GATS7p -3.0310(±0.8296) 3.4705 0.3296 0.3152 0.2916 13.348 1.7036 09 B10[N-N] 2.0051 (±0.1589) 0.1149 0.1563 0.8459 0.8406 159.185 5.8830 10 B10[N-N] 2.1527 (±0.2031) 0.1274 0.1554 0.8529 0.8424 81.195 5.9418 11 CATS2D_06_PL -0.0534(±0.0461) B10[N-N] 2.0383 (±0.1604) 0.1482 0.1553 0.8531 0.8426 81.313 5.9462 12 Psychotic_80 -0.0665(±0.0567) B10[N-N] 1.9578 (±0.1595) 0.8738 0.1535 0.8565 0.8463 83.582 6.0286 13 VE1_D -0.1531(±0.1063) B10[N-N] 2.1064 (±0.1645) -0.0703 0.1512 0.8608 0.8508 86.559 6.1352 14 F08[C-C]_ 0.0076 (±0.0044) B10[N-N] 1.8150 (±0.1588) 1.3047 0.1409 0.8791 0.8704 101.768 6.6524 15 GATS7p -1.0902(±0.3934) B10[N-N] 2.0531 (±0.1161) 0.3550 0.1139 0.9211 0.9154 163.392 8.4292 16 cRo5 -0.2881(±0.0558) B10[N-N] 2.0441 (±0.1161) 0.0110 0.1135 0.9243 0.9159 109.961 8.4688 17 cRo5 -0.2993(±0.0566) GATS8p 0.3194 (±0.2959) @ IJTSRD | Available Online @ www.ijtsrd.com | Volume – 2 | Issue – 2 | Jan-Feb 2018 Page: 777
International Journal of Trend in Scientific Research and Development (IJTSRD) ISSN: 2456-6470 B10[N-N] 1.6839 (±0.1503) 2.8947 0.1266 0.9059 0.8955 86.651 7.5179 18 GATS7p -1.3914(±0.3696) VE1_D -0.2545(±0.0917) B10[N-N] 2.0441 (±0.1161) 0.0110 0.1135 0.9243 0.9159 109.961 8.4688 19 cRo5 -0.2993(±0.0566) GATS8p 0.3194 (±0.2959) B10[N-N] 2.0418 (±0.1128 ) 0.2238 0.1104 0.9284 0.9205 116.710 8.7250 20 cRo5 -0.3331(±0.0605 ) DLS_07 0.1874 (±0.1127) GATS7p -0.5630(±0.330) 0.3466 0.1102 0.9287 0.9208 117.279 8.7461 21 cRo5 -0.2518(±0.0580 ) B10[N-N] 1.9489 (±0.1280) B10_N_N 2.1541 (±0.1176) 2.2910 0.1078 0.9318 0.9242 122.890 8.9532 22 F08[C-C] 0.0241 (±0.0044) VE1_D -0.5575(±0.1052) B10[N-N] 1.9040 (±0.1308 ) 1.0557 0.1087 0.9332 0.9229 90.733 8.8833 23 cRo5 -0.2806(±0.0614 ) GATS7p -0.6753(±0.3374 ) Psychotic_80 0.0602 (±0.0459) B10[N-N] 2.1076 (±0.1180 ) -0.0005 0.1077 0.9344 0.9243 92.610 8.9744 24 cRo5 -0.3207(±0.0595 ) DLS_07 0.2707 (±0.1225) F08[C-C] 0.0057(±0.0037) B10[N-N] 1.8582 (±0.1373) 1.8367 0.1073 0.9349 0.9249 93.381 9.0117 25 cRo5 -0.2114(±0.0621 ) GATS7p -0.8065(±0.3573) VE1_D -0.1343(±0.0854) B10[N-N] 2.1734 (±0.1174) 2.1885 0.1067 0.9357 0.9258 94.543 9.0678 26 DLS_07 0.1452 (±0.1155) F08[C-C] 0.0272 (±0.0050) VE1_D -0.5780(±0.1054) B10[N-N] 2.1271 (±0.1163) 1.7237 0.1053 0.9373 0.9277 97.182 9.1933 27 cRo5 -0.1239(±0.0817) F08[C-C] 0.0166(±0.0066) @ IJTSRD | Available Online @ www.ijtsrd.com | Volume – 2 | Issue – 2 | Jan-Feb 2018 Page: 778
International Journal of Trend in Scientific Research and Development (IJTSRD) ISSN: 2456-6470 VE1_D -0.3850(±0.1533) B10[N-N] 2.1824 (±0.1155) 2.3142 0.1047 0.9380 0.9285 98.405 9.2508 28 F08[C-C] 0.0308 (±0.0060) Psychotic_80 0.0926 (±0.0571 ) VE1_D -0.6044(±0.1062) B10[N-N] 1.9208 (±0.1222) 0.8730 0.1045 0.9383 0.9288 98.803 9.2698 29 cRo5 -0.2982(±0.0597) DLS_07 0.2156 (±0.1075) GATS7p -0.6447(±0.3162) B10[N-N] 1.9399 (±0.1235) 3.3488 0.0939 0.9502 0.9425 124.031 10.3859 30 F08[C-C] 0.0197 (±0.0041) GATS7p -0.9062(±0.2920) VE1_D -0.5498(±0.0916) Table 5 observed and estimated IC50 values Using model 30 (Table 4) Model No. Obs. pIC50 Est. pIC50 Residual 0.068 0.12111 -0.0531 1* 0.918 1.88321 -0.9652 2* 2.12 2.12 0 3 0.028 0.08382 -0.0558 4* 0.102 0.053 0.049 5 0.034 -0.011 0.045 6 0.022 0.204 -0.182 7 0.003 -0.012 0.01504 8* 0.003 0.063 -0.06 9 0.011 0.015 -0.004 10 0.002 0.04 -0.038 11 0.006 0.033 -0.027 12 0.046 0.063 -0.017 13 0.004 -0.043 0.047 14 0.005 0.052 -0.047 15 0.034 0.108 -0.074 16 0.041 0.06727 -0.0263 17* 0.009 0.06183 -0.0528 18* @ IJTSRD | Available Online @ www.ijtsrd.com | Volume – 2 | Issue – 2 | Jan-Feb 2018 Page: 779
International Journal of Trend in Scientific Research and Development (IJTSRD) ISSN: 2456-6470 0.004 -0.0811 0.08512 19* 0.037 -0.048 0.085 20 0.036 0.05818 -0.0222 21* 0.353 0.146 0.207 22 0.032 0.05681 -0.0248 23* 0.01 0.078 -0.068 24 0.026 0.021 0.005 25 0.058 -0.0464 0.10444 26* 0.076 0.081 -0.005 27 0.164 0.14979 0.01421 28* 0.067 0.11 -0.043 29 0.02 0.122 -0.102 30 0.067 0.074 -0.007 31 0.066 0.031 0.035 32 0.133 0.13493 -0.0019 33* 0.11 0.04 0.07 34 0.057 0.015 0.042 35 0.018 0.133 -0.115 36 0.133 0.204 -0.071 37 0.364 0.162 0.202 38 0.279 0.28 -0.001 39 0.694 0.528 0.166 40 0.296 0.412 -0.116 41 0.287 0.283 0.004 42 0.219 0.2 0.019 43 2.5 y = 0.950x + 0.009 R² = 0.950 2 Est. pIC50 1.5 Traini ng 1 y = 2.069x - 0.051 R² = 0.979 0.5 0 0 1 2 3 -0.5 Obs.pIC50 Fig.1 Correlation between observed and estimated pIC50 @ IJTSRD | Available Online @ www.ijtsrd.com | Volume – 2 | Issue – 2 | Jan-Feb 2018 Page: 780
International Journal of Trend in Scientific Research and Development (IJTSRD) ISSN: 2456-6470 Table 6 Cross validated parameters for the best obtained models R2cv Model Parameters used PRESS SSY PRESS/SSY SPRESS PSE no B10[N-N] 0.709 3.891 0.182 0.818 0.156 0.071 10 B10[N-N] 0.363 4.236 0.086 0.914 0.114 0.061 16 cRo5 B10[N-N] 0.314 4.286 0.073 0.927 0.108 0.059 22 VE1_D F08_C_C_ B10_N_N_ 0.229 4.37 0.052 0.948 0.094 0.055 30 F08_C_C_ VE1_D GATS7p Table 7 Ridge regression parameters for the best obtained models. Model no Parameters used VIF T λi K B10[N-N] 1.0000 1.0000 1.0000 1.0000 10 B10[N-N] 1.0065 0.9936 1.080064 1.00 16 cRo5 1.0065 0.9936 0.919936 1.17 B10[N-N] 1.1520 0.8680 1.895320 1.00 22 VE1_D 2.0735 0.4823 0.840262 2.26 F08_C_C_ 2.2741 0.4397 0.264419 7.17 B10[N-N] 1.6753 0.5969 1.903822 1.00 30 F08_C_C_ 2.5824 0.3872 1.420041 1.34 VE1_D 2.0750 0.4819 0.449074 4.24 GATS7p 1.5276 0.6546 0.227063 8.38 VIF = Variance Inflation Factor T = Tolerance λi = Eigen values k = Condition number @ IJTSRD | Available Online @ www.ijtsrd.com | Volume – 2 | Issue – 2 | Jan-Feb 2018 Page: 781
International Journal of Trend in Scientific Research and Development (IJTSRD) ISSN: 2456-6470 Ridge Trace 1.00 Variables VE1_D GATS7p B10_N_N_ F08_C_C_ S tand ard ized B e tas 0.65 0.30 -0.05 -0.40 10-4 10-3 10-2 K 10-1 100 Fig.2 Ridge trace for four variable model Variance Inflation Factor Plot 101 Variables VE1_D GATS7p B10_N_N_ F08_C_C_ VIF 100 10-1 10-4 10-3 10-2 K 10-1 100 Fig. 3 VIF plot for four-variable model 8)R.Arav-Boger, PharmacolToxicol;2005,45,565. T. Shapiro; A.Anna;Rev REFERANCE: 1)F.Nosten, T.Chogsuphajaisiddhi,C.Luxemburger,H.K.Webst er&M.Edstein, L.Phaipun,K. L.Thew& N. J. White; Lancet;1982,331,1140. 9)B.P. Das, D.W. Boykin;JMedChem;1977,20,531. F. TerKuile, 10)J. Anne, E.D. Cierec, H.Eyssen&O. Dann;AntimicrobAgentsChemother;1980,18, 231. 11)R.R.Tidwell,C.A. Bell, J.E. Hall, D.E.Kyle,M. Grogl;Antimicob Agent Chemother;1990,34,1381. 2)A.M.Oduola,W.K.Milhous,L.A.Salako&O.Walker ; Lancet;1987,2,1304. 12)R.R.Tidwell,S.K.Jones,J.D.Geratz, K.A.Ohemeng, M. Cory, J.E. Hall; JMedChem; 1990,33,1252. 3)P. Carson, C. Flanagan, C.E.Lekes& A. Alvin; Science;1956,124,484. 13)J.J.Brendle, A. Outlaw,A. Kumar,D.W. Boykin, D.A.Patrick,R.R.Tidwel,K.A.Werbovetz;Antimicr ob Agents Chemother;2007,46,4761. 4)P.E. Carson, C.I.Flanagan,C.E.Lakes,A.S. Alvin; Science;1982,31,427. 5)H.L. R.N.Rossan&W.I. Squires; Am J Trop Med Hvg;1982,31,612. Schmdt,R.Frank,C.S.Genther, 14)P.G. Bray,M.P.Barrett,S.A.Ward,H.P. De Koning; Trends Parasitol; 2003,19.232. 15)M.Stead,P.G. Bray, I.G. Edward, H.P. De Koning, B.C.Elford, P.A. Stocks & S.A. Wardol; Pharmacol,2001,59,2001,1298. 6)J.L.Bras,R. FundanClinPharmacol;2003,17,147. Durand; 7)J.E. Hyde; Trends Parasitol;2005,21,494. 16)A.H.Fairlamb;TrendsParasitol; 2003,19,488. @ IJTSRD | Available Online @ www.ijtsrd.com | Volume – 2 | Issue – 2 | Jan-Feb 2018 Page: 782
International Journal of Trend in Scientific Research and Development (IJTSRD) ISSN: 2456-6470 17)R. Docampo, S.N. Moreno; Parasitol, Res;2003,90,510. 18)R.J.Burchomore, P.O. Ogbunude,B. Enanga, M.P. Barrett;curr Pharm LDes;2002,8,256. 19)B.Shaika, T.Kaushal and V. K. Agrawal ; J. Indian Chem. Soc., 2016,93,876. 20)S.Paliwal, J.Sharma and S.Paliwal ; Indian J. Chem., 2012,51B,617. 21)D. Legros,G.Ollivier,M.E. Gastellu, C. Paquet,C. Burri,lancetInfec Dis,2002,2,437 22)Dragon Software for calculation of Topological Indoses,www.disat.unimib,it. 23)NCSS, statistical analysis software,www.ncss.com (Accessed May 2005) 24)S.Cheterjee, A.S.Hadi, B. Price; Regression analysis by Examples,3rd.ed.; Wiley &Sons:New York;6,141-153. 25)L. Pogliani,Structure Property Relationship Of Amino Acids and Some Dipeptide, Amino acids;1994,6,141-15 @ IJTSRD | Available Online @ www.ijtsrd.com | Volume – 2 | Issue – 2 | Jan-Feb 2018 Page: 783