Download
1 / 44
440 likes | 631 Vues
A Mathematical Model of Motion. Chapter 5 Sections 1 and 2. Objectives Quiz 4. Interpret graphs of position versus time for a moving object to determine the velocity of the object Describe the information presented in graphs and draw graphs from descriptions of motion

E N D
A Mathematical Model of Motion Chapter 5 Sections 1 and 2
Objectives Quiz 4 • Interpret graphs of position versus time for a moving object to determine the velocity of the object • Describe the information presented in graphs and draw graphs from descriptions of motion • Write equations that describe the position of an object moving at constant velocity
Objectives Quiz 4 • Determine from a graph of velocity versus time, the velocity of an object at a specified time • Interpret a v-t graph to find the time at which an object has a specific velocity • Calculate the displacement of an object from the area under a v-t curve
Position-Time Graphs • Shows where the object is at time intervals • X is time (Independent Variable) • Y is position (Dependent Variable) • Slope is velocity (Rise over Run, D over T) • No slope is no movement • Large slope is large velocity
Velocity Graphs • Show rate of change in position • When flat, constant velocity • When line falling, slowing down (or speeding up in reverse direction) • When line falling, speeding up • Area under graph is displacement
Acceleration Graphs • Show change in velocity • When line is straight, Constant acceleration • When line is flat, No Acceleration • When line is rising, increasing velocity • When line is falling, decreasing velocity
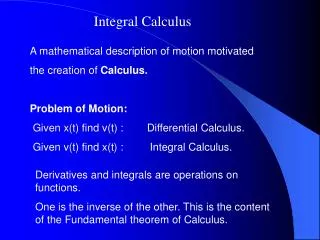
Connect • Slope of Distance-Time graph is velocity • Slope of Velocity-Time graph is acceleration • Derivatives
Graph A • What is the velocity of the object from 2 – 4 seconds?
Graph A • What is the average velocity of the object?
Graph A • At what time's does the object have a negative acceleration?
Graph A • At what time is the object located at 11 m? • How many significant digits?
Draw a Position-Time Graph • A man • walks at a constant velocity of 2.0 m/s for 5 seconds. • The man stops for 3 seconds. • The man resumes his walk but walks slower at 1.0 m/s for 5 seconds
Draw a Position-Time Graph • A Dragster in a race
Interpreting Graphs • On the following slides, describe the motion of the object • What real life event could the graph be showing?
Velocity-Time Graphs • Shows objects velocity at time intervals • Y is Velocity • X is Time • No slope is constant speed • Positive slope is Positive acceleration • Large slope is large acceleration
Graph B • Total Displacement?
Graph B • Average Velocity?
Graph C Greatest Acceleration is where?
Graph C • Average Velocity?
Graph C • Total Displacement?
Graph D • Total Distance Covered?
Graph D • Average Velocity?
Graph D • Acceleration at different parts of graph?
For the next slides, determine what the acceleration is • For the next slides, determine how far the object was displaced • Area under graph is displacement
Draw a D-T and V-T graph from situation described • A car is driving down the road at 55 mph and gets a flat tire. The car slows down to a stop. The driver changes the tire and then continues driving and moves at 35 mph.
Draw a D-T and V-T graph from situation described • A bullet is fired from a gun and travels 1000 meters in one second before hitting a solid target.
Draw a D-T and V-T graph from situation described • At basketball practice, coach has you run the down and backs the length of the court. You do 3 down and backs with each trip taking slightly longer than the last
Position Time • Fastest object? • Stopped object? • Negative velocity? • Accel?
Velocity Time (mid line 0, above positive) • Slowest? • Fastest? • Stopped? • + Accel • - Accel