Download
1 / 21
210 likes | 241 Vues
Learn about NASA's heritage of hurricane research, joint partnerships with NOAA HRD, blending of in-situ and satellite data sets, and improved modeling techniques.

E N D
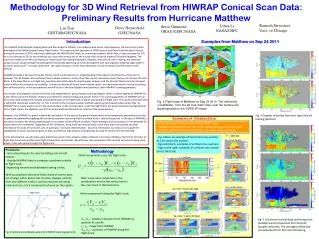
NASA’s Hurricane Research Program Jack A. Kaye Director, R&A Program Earth-Sun System Division March 20, 2006
RESEARCH SYNERGY Models TRMM Aircraft Satellite A Three-Pronged Approach
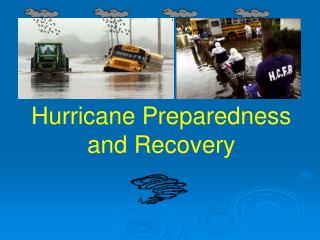
NASA’s Heritage of Hurricane • Research Field Programs • Joint partnership with NOAA HRD • Blending of in situ and satellite data sets • Improved parameterization of models • Data assimilation to improve models • Technology testbed (i.e. ER-2 dropsonde, Aerosonde) • TCSP (2005) • Genesis in EPAC, GOMEX, ATL • Rapid intensification • Easterly wave dynamics • Satellite cal/val • CAMEX-3 (1998) • Inner core dynamics • Synoptic flow environment • Landfalling intensity change • Genesis environment • CAMEX-4 (2001) • Rapid intensification • Storm movement • Structure and dynamics • Scale interactions • Remote sensing techniques
NASA ER-2: Virtual Satellite Advanced Microwave Precipitation Radiometer Lightning Imaging Sensor MODIS TRMM Microwave Imager Precipitation Radar ER-2 Doppler Radar AMSR-E
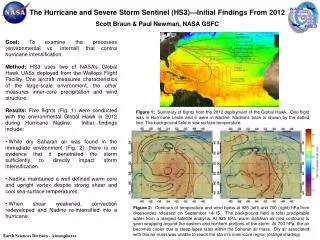
ER-2 Doppler Radar (EDOP) Views Detailed Super-Anatomy Of Intense Hurricane Emily During NASA’s TCSP Experiment INTENSE EYEWALL THUNDERSTORM EYEWALL heavy EYE Preliminary Data Height - 60,000 feet Rain Intensity light east Distance - 210 miles west • High impact (strong category) storm during US landfall • Strongest hurricane ever overflown by a NASA research aircraft • Deepest “hot tower” ever imaged by the ER-2 airborne Doppler radar
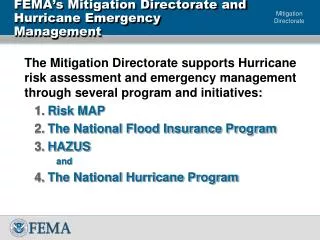
NASA/NOAA/Aerosonde Partnership • NASA: Provided project management support, airfield, restricted area access, airspace coordination, payload engineering review as well as flight and ground safety review/oversight. • NOAA: Provided science analysis funding to the PI who also made the data available in real-time to National Hurricane Center forecasters. • Aerosonde: Provided the aircraft, manpower for maintenance and operations, and made the data available to the PI at the Hurricane Research Division in real-time.
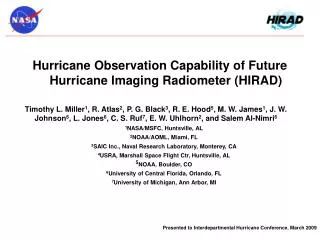
NASA Satellites contributing to Hurricane Research • SatelliteMeasurement • TRMM Precipitation Rates, 3-D Precipitation Structure, SST • Aqua Temperature, Moisture, SST, Precipitation, Flood Extent • QuickSCAT Ocean Vector Winds • Multiple Satellites Rain Accumulation • TOPEX, Jason Tropical Cyclone Heat Potential • Landsat 7 Flood Extent
NASA Satellites Observe the Birth and Intensification of Hurricane Katrina AMSR-E (Aqua) SSTs August 15-27 Energy Rain NASA/SVS QuickSCAT Winds August 25, 4:37 AM Wind TRMM Precipitation Radar August 28, 10:25 pm Red = 2 inches/hr QuickSCAT Science Team, JPL
A Look Inside Katrina’s Rain Bands • The Precipitation Radar aboard NASA’s TRMM satellite can measure rain rates over time (see movie below) as well as vertical structure within severe storms (see 3-D slight at right). The movie spans Aug. 23-31, while the 3-D snapshot shows Katrina on Aug. 28, 2005, while it was still a Category 5 storm.
NASA Multi-Satellite Precipitation Analysis (MPA) of Hurricane Katrina’s Rain Accumulation Rain history of Katrina from genesis over Bahamas to her extratropical transition over the Ohio Valley • Heaviest rains fell as the storm was Cat 1 during and after landfall over south Florida • Rain swath widened dramatically as the storm intensified to Cat 5 • Rapid forward speed limited inland rain accumulations • Rain swath traces a broad arc around the western flank of the Atlantic subtropical ridge
Overarching Goals - MAP ‘05 • Understand capabilities for NASA models to predict tropical cyclones & other extreme weather events (GEOS4 & new GEOS5) • Contribute NASA models to the Florida State University hurricane “Superensemble” to test their impact • Deliver output directly to National Hurricane Center for offline evaluation • Exploit Project Columbia capabilities to deliver model output at unprecedented horizontal resolution (1/4 x 1/4) while meeting NOAA operational delivery schedules GEOS4: Existing Model GEOS5: Model in Beta Testing GEOS-4 Sept 24 forecast for rita, ic: Sept 22
GEOS5: Encouraging Results Sample Training Runs for FY04 hurricane cases GEOS-5 shows early forecast of New Orleans landfall for Katrina
Flooding in New Orleans • The false-color Landsat 7 image below shows an 80% flooded downtown New Orleans on Sept. 7, shortly after officials began pumping water back into Lake Pontchartrain. • The image above shows New Orleans on Sept. 15, after much of the floodwater had been pumped out. Officials estimated 380 cubic meters of water per second were pumped back into the lake.
Flood Assessment • Flood Extent of Katrina-Using NASA Satellite Data
Dauphin IslandProspective:Lidar measurementsfrom NASA instrumented aircraftshowing erosion &deposition on barrierisland
AVIRIS Measurements in Support of Katrina Response Flooded New Orleans Core Example • • MEASURMENTS • - 62 flight lines over 6 days of New Orleans and Biloxi. • - 10 m spatial and full spectrum 370 to 2510 nm @ 10 nm. High uniformity, calibration accuracy, precision (SNR) • OBJECTIVE Impact of flood and devastation assess via NASA advanced imaging spectroscopy Example: Flood water composition, particulate distribution, oil contamination, methane leaks, environmental damage, fires, • ANALYSIS STATUS Calibrated radiance being produced Inversion from radiance to reflectance in process Spectroscopic analysis to follow Super Dome Mississippi Flood Sediments
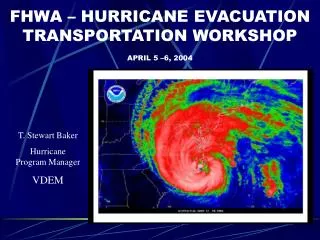
ESS Planned Hurricane Field Campaign: NAMMA-06 • Out of Africa: African Easterly Waves are the progenitors of many late-season, strong category hurricanes that strike the U.S. • Leverages off AMMA SOP-3 and will be based in Cape Verde • Multidisciplinary approach involving Weather, Water & Energy, Composition foci • Partnering with European consortium, NOAA HRD • NAMMA-06 science in line with CCSP objectives • Platforms to include DC-8, Aerosonde, TOGA & NPOL radars, micropulse lidars African SAL: Impact on tropical cyclogenesis - hypothesize to be a hurricane suppressant, in an ocean marginally suitable for hurricane generation; examine SAL impact on microphyiscs, thermodynamic instability, shear,airmass dessication
Planning Activities • Satellites • GPM (delayed) • NPP (delayed) • Wind Lidar (roadmap plan) • 4 IIP proposals selected Models • Improving GEOS5 parameterization and data assimilation techniques Field Experiments • NAMMA06 • Joint NASA/NOAA plans for UAV flights • Collaboration with NOAA, NSF and DOD perhaps under the THORPEX umbrella