Download
1 / 70
870 likes | 1.64k Vues
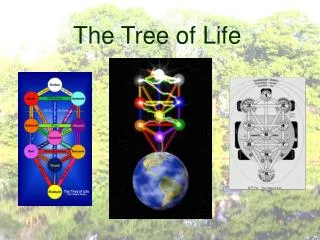
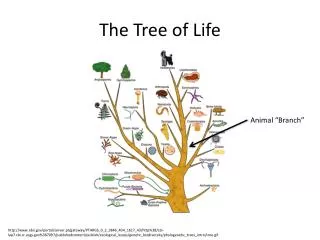
Lecture 4: Phylogeny and the Tree of Life Campbell & Reece: Chapter 26. Bacterium. Amoeba. Pine tree. Rattlesnake. Humans. All life is interconnected by descent. How to determine the pattern of descent?.

E N D
Lecture 4: Phylogeny and the Tree of LifeCampbell & Reece: Chapter 26
Bacterium Amoeba Pine tree Rattlesnake Humans All life is interconnected by descent How to determine the pattern of descent?
Systematics - field of biology dealing with diversity and evolutionary history of life Includes Taxonomy: DINC Description Identification Nomenclature Classification Goal: • Determine Evolutionary History (Phylogeny) of Life
Description = assign features Character = a feature (e.g., “petal color”) Character states = two or more forms of a character (e.g., “red,” “white”).
Identification = associate an unknown with a known How? One way: Taxonomic Key, e.g., Tree …………………………………….…………… Species A Leaves simple …….………………………… Species B Leaves pinnate …….………..…..…..…… Species C Herb Flowers red …….…………………………… Species D Flowers white …….…………………..…… Species E
Nomenclature Naming, according to a formal system. Binomial: Species are two names (Linnaeus): E.g., Homo sapiens Homo = genus name sapiens = specific epithet Homo sapiens = species name
Nomenclature Hierarchical Ranks: Domain Kingdom Phylum Class Order Family Genus Species
Classification • Placing objects, e.g., life, into some type of order. • Taxon = a taxonomic group (plural = taxa).
How to classify life • Phenetic classification • Based on overall similarity • Those organisms most similar are classified more “closely” together.
Problem with phenetic classification: • Can be arbitrary, e.g., classify these:
Phylogenetic classification • Based on known (inferred) evolutionary history. • Advantage: • Classification reflects pattern of evolution • Classification not ambiguous
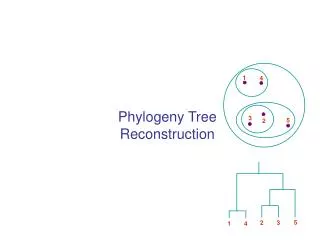
Ingroup – group studiedOutgroup – group not part of ingroup, used to “root” tree
Branch point (node) Taxon A Taxon B Fig. 26-5 Sister taxa Taxon C ANCESTRAL LINEAGE Taxon D Taxon E Taxon F Common ancestor of taxa A–F Polytomy
Apomorphy (derived trait) • = a new, derived featureE.g., for this evolutionary transformation scales --------> feathers(ancestral feature) (derived feature) • Presence of feathers is an apomorphyfor birds.
Taxa are grouped by apomorphies Apomorphies are the result of evolution. Taxa sharing apomorphies underwent same evolutionary history should be grouped together.
Principle of Parsimony That cladogram (tree) having the fewest number of “steps” (evolutionary changes) is the one accepted. Okham’s razor: the simplest explanation, with fewest number of “ad hoc” hypotheses, is accepted.
Other methods of phylogeny reconstruction: • Maximum Likelihood or Bayesian analysis • Uses probabilities • Advantage: can use evolutionary models.
Sequentially group taxa by shared derived character states (apomorphies) TAXA Lancelet (outgroup) Fig. 26-11 Lancelet (outgroup) Salamander Lamprey Lamprey Leopard Turtle Tuna Tuna Vertebral column (backbone) 1 1 1 1 1 0 Vertebral column Hinged jaws 1 1 1 1 0 0 Salamander Hinged jaws CHARACTERS 1 0 0 0 1 1 Four walking legs Turtle Four walking legs 1 1 0 0 0 0 Amniotic (shelled) egg Amniotic egg Leopard 0 1 0 0 0 0 Hair Hair (b) Phylogenetic tree (a) Character table
DNA sequence data – most important type of data 1 Fig. 26-8a Deletion 2 Insertion
DNA sequence data - alignment 3 Fig. 26-8b 4 Each nucleotide position = Character Character states = specific nucleotide
Homology • Similarity resulting from common ancestry. • E.g., the forelimb bones of a bird, bat, and cat.
Homoplasy (analogy) • Similarity not due to common ancestry • Reversal – loss of new (apomorphic) feature, resembles ancestral (old) feature. • Convergence (parallelism) – gain of new, similar features independently.
Convergent evolution:spines of cacti & euphorbs Cactus Euphorb
Convergent evolution:spines of cacti & euphorbs cactus spines euphorb spines
Both examples of reversal within Tetrapods: loss of a derived feature – forelimbs. Leg-less lizards Snake legged lizards leg-less lizards snakes * * Example of convergence relative to one another!Independently evolved. *= loss of legs gain of legs (Tetrapods)
Convergent evolution:wings of some animals evolved independently
Convergent evolution:Australian “mole” and N. Am. “mole” Fig. 26-7
Gene Duplication can occur! Ancestral gene Ancestral species Speciation with divergence of gene Orthology – genes homologous Fig. 26-18 Orthologous genes Species A Species B (a) Orthologous genes Species A Gene duplication and divergence Paralogy – genes not homologous Paralogous genes Species A after many generations (b) Paralogous genes
Monophyletic Group • a group consisting of: • a common ancestor + • all descendents of that common ancestor
C B F E D A Cladograms can be “flipped” at nodes, show same relationships
One can date divergence times with molecular clock and fossils Drosophila Lancelet Fig. 26-13 Zebrafish Frog Chicken Human Mouse PALEOZOIC MESOZOIC CENOZOIC 542 251 65.5 Present Millions of years ago
Relationship • = recency of common ancestryi.e., taxa sharing a common ancestor more recent in time are more closely related than those sharing common ancestors more distant in time.
Example: • Are fish more closely related to sharks or to humans?
Example: • Are crocodyles more closely related to lizards or to birds?