Ordnance Survey Maps
Ordnance Survey Maps. Can anyone remember what OS maps are?. Keywords. Scale Grid Reference Slope Legend/ key Settlement. Ordnance Survey Maps. We will learn how to Use scale. Measure straight and curved lines. Write grid references. Tell direction.

Ordnance Survey Maps
E N D
Presentation Transcript
Ordnance Survey Maps Can anyone remember what OS maps are?
Keywords • Scale • Grid Reference • Slope • Legend/ key • Settlement
Ordnance Survey Maps We will learn how to Use scale. Measure straight and curved lines. Write grid references. Tell direction. Read height and slope on a map. Draw a sketch map. Calculate area. Use a legend/key. Learn about settlement.
Why is an OS map so small? • Remember that a map is a picture of a much larger area of land. In order to be useful, a map must be small enough to fit into someone’s hands. • A full-size map of the Earth would be too large to make. • Maps are scaled down so that they fit on the available paper or screen.
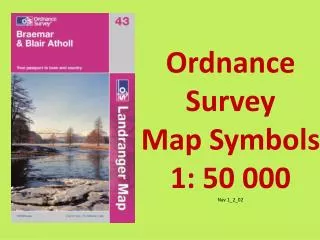
Scale Scale is the relationship between a distance on a map and the distance on the ground. Scale on OS map = 1:50,000 1cm on the map = 50,000cm (500m) on the ground (in real life!) Class Activity: • What would 1km on the ground be in cm on the map? • Look at the examples of an OS map. Find the scale. Make 3 observations about the scale.
Direction • North South East and West – Easy!! • Can you remember all the other directions??
Measuring Distances on maps • Measuring straight line distances (‘as the crow flies’). • Measuring curved line distances e.g. roads, railways and rivers.
Straight Line Distances What you need – piece of paper folded over. pencil scale ( on the OS map!!) • Fold over a piece of paper. • Put the edge of the paper at the start point and place the other edge at the other point. Mark the paper at both edges. • Using the scale measure the difference between the two marks. • Remember use km!
Activity Using the OS maps pick any two points and measure the distance! Help each other!
Curved Line Distances • Lay a piece of folded over paper at the starting point and mark with a pencil. • Keep moving the paper around the curved line.. Every time the road curves move the paper. • Mark the end point on your paper and use the scale to measure the distance of the line.
Activity • Using the OS map measure the following curved line distances!
Today’s Class • Grid References
Grid References What do you remember about grid references from last year?
Remember L.E.N L – Letter E – Easting N - Northing No R T H I N G Easting
Grid References • Four figure grid references – for a single square on the map. S40 52 • Six figure grid references – for an exact location of small features. S401 528 Can anyone remember what you have to do to get a 6 figure grid reference?
6 Figure Grid Reference Use LEN but…. To get 6 figures you need to divide the boxes into 10 lines. Class Activity: Ballina OS map pg 172. 4 figure grid reference: Cloonah Lough. Carvan and camping park. 6 figure grid reference Tourist information site Moated site Standing stone Hospital.
Today’s Class • Measuring area
Calculating Area From your maths course what is area? To calcluate the area of a rectangular area • Count the number of squares across • Count the number of squares up • Multiply the two numbers and make sure to use km squared.
Calculating Area • To calculate area of an irregularly shaped area e.g. sea • Tick all the squares that are fully covered with the sea. • Tick any boxes that are more than half covered with the sea • Add the two numbers together. • Make sure to use km2
Activity • Calculate the area of the Ballina map on page 172. • Calculate the area of the Cork map on pg 176. • Calculate the area of Lough Mahon on pg 176.
Today’s Class Symbols and the legend Height on OS maps Slope Sketch maps
Symbols • The best thing about the symbols on an OS map is that you don’t have to learn them off by heart!! • They are all on the legend/key at the back of the map. Let’s look at the map of Cork.. Can you guess what the symbols are without looking at the legend.
Height on OS maps • 4 ways to show height • Triangle with a number next to it. • Spot Height - .567 • Contour lines – line joining places of equal height. Close contours = steep slope. • Colour layers – green = low ground brown = high ground.
Slope Contour lines show what type of slope is present. There are 4 types • Even • Concave • Convex slope • Compound slope.
Activity • Draw the table into your copies. Use the full A4 page. • Use colour to help you remember which ones are which. Activity 2: What slope am I? Test each other.
Drawing a sketch map • In groups try to remember how we drew sketch maps last year. Remember we did this last year!
Today’s Class • Settlement – Rural & Urban
Settlement What do you think settlement means? Hint:
Settlement: Place where people live! Keywords • Ancient settlement: • Rural Settlement • Urban Settlement
Density of settlement • The number of houses per square kilometre (km²) • Houses on OS maps are shown as black dots City: High density Countryside: Low density
RURAL SETTLEMENT • Some factors attract people to settle in a particular area, whereas some factors stop people from settling in an area. Can you think of any? • Altitude—People want to live in lowland areas. • Shelter—The foot of hills and mountains or valley floors provide shelter from the elements.
Aspect – South facing to get the most sunshine • Drainage—people settle in well drained land • Slope – Settlement tends to avoid steep sloping areas because it is difficult to farm and construct roads. Also lowland areas have better soil for farming !
Settlement patterns • Linear or Ribbon • Clustered or Nucleated • Dispersed or Scattered
Activity • Using the OS maps find the different patterns of rural settlement.
Urban Settlement: Where do towns develop? • On flat or gently sloping lowlands • Transport construction is easier, Building is easier and land is better (Agriculture) • Where roads or other transport routes meet (Nodal/Focus Point) • At such places, people meet, trade develops and settlement grows • At Bridging points of rivers • Where bridges exist, roads usually meet and towns develop • Rivers were very important (Water supply, food, Transport and Defence)
At coastal locations • Many towns developed as trading or fishing ports • Historical Influences • Many towns developed as a result of Castles, Monasteries etc. (Protection)
Urban Functions • Towns have many functions or uses. Towns often have many functions. Can you think of them?
Urban Functions • Look at the functions on page 143. • Read as a group. Activity: Make a list of the functions in Carrick on Suir.
End of Chapter! But don’t worry we will be seeing much more of OS maps for the rest of the year!!!