Download
1 / 32
320 likes | 442 Vues
Climate change: the science, the IPCC, and the media. Neville Nicholls School of Geography & Environmental Science Monash University. Unprecedented droughts.

E N D
Climate change: the science,the IPCC, and the media Neville Nicholls School of Geography & Environmental Science Monash University
Unprecedented droughts • In each of the last 13 years, Melbourne annual total rainfall has been below average. Prior to this dry period, the longest period of below average rainfall was six years. • In the last nine years, annual rainfall in the Murray Darling Basin (the “breadbowl” of Australia) the rainfall has been below 500mm. Prior to the current dry period, the longest period of below 500mm was six years.
Unprecedented hot temperatures:a few examples • Adelaide (March, 2008): 15 consecutive days above 35C – seven days more than the previous record heatwave duration. • The Melbourne temperature on three successive days at the end of January 2009 exceeded 43C; never previously seen three days in a row reach 42C, let alone 43C. • Black Saturday (2009) set a new Melbourne record temperature of 46.4C, more than 3C hotter than the previous February record. • The seven hottest August days ever recorded at Windorah in western Queensland all occurred in 2009. The new record August maximum temperature for Windorah is 38C; the record prior to 2009 was 34.2C. • Mean monthly NSW temperature in November 2009 was 4.61C higher than normal. • Murray Bridge (near Adelaide) had 6 days in a row >40C in November 2009; never previously had more than a single day >40C. • Melbourne has had 110 days in a row reaching over 20C, December 2009-March 2010 (previous record was 78 days – set in 2000)
Melbourne record mean daily temperature (average of max and min) • Data since 1855 • 15 December 1876: 34.2˚C • 21 January 1997: 34.25˚C • 22 January 2006: 34.55˚C • 29 January 2009: 35.0˚C • 30 January 2009: 35.4˚C • Record broken 4 times in 12 years; now 1.2˚C warmer than record prior to 1997.
Melbourne, 1979-2001 27-30 January 2009: 42.3˚C
John Tyndall, 1861 “…a slight change in its [the atmosphere’s] variable constituents…may have produced all the mutations of climate which the researches of geologists reveal.” Tyndall (1861)
Greenhouse effect: history • John Tyndall (1861): shows CO2, water vapour are “greenhouse gases” • Guy Callendar (1930s): atmospheric CO2 concentration increasing, leading to warming • Gilbert Plass (1950s): Predicted warming of about 2C by 2000. • 1972: John Sawyer “The increase of 25% in CO2 expected by the end of the century therefore corresponds to an increase of 0.6ºC in world temperature” • 1988: Intergovernmental Panel on Climate Change (IPCC) established
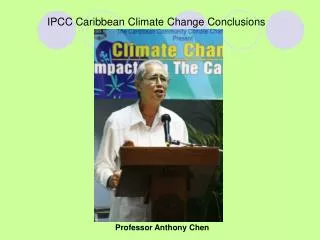
The IPCC is a “remarkable example” of mobilizing expert analysis to inform policymakersJeffrey Sachs (Nature, 12 August 2004) The IPCC assessments are “dull as dishwater” Tim Flannery, The Weather Makers
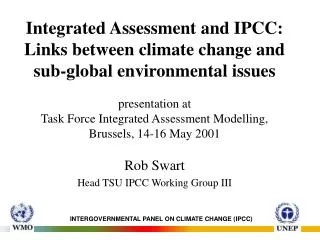
Role of the IPCC to assess…the scientific, technical and socio-economic information relevant to understanding the scientific basis of risk of human-induced climate change, its potential impacts and options for adaptation and mitigation IPCC reports should be neutral with respect to policy Review is an essential part of the IPCC process Membership open to any member country of UNEP and WMO Four small (5-10 staff) Technical Support Units. Other participation (by scientists) is pro bono
Annual numbers of peer-reviewed journal papers on “climate change”, or “greenhouse effect” or “global warming”
Structure of IPCC AR4 Assessment • 3 Working Group Reports: • Full Reports • Each ~1000 pages • Extensive expert and government review • “Accepted” by IPCC Working Group Plenary • Summaries for Policy Makers • Typically 20 pages • Detailed expert & government review • “Approved” line-by-line by Working Group Plenary • Synthesis Report • Synthesizes the 3 WG reports • About 30 pages, with 5 page Summary for Policy Makers • SPM “approved” line-by-line by IPCC Panel, November 2007
AR4 WGI: The Physical Science Basis • Historical overview of climate change science • Changes in atmospheric constituents and in radiative forcing • Observations: Surface and atmospheric climate change • Observations: Changes in snow, ice and frozen ground • Observations: Oceanic climate change and sea level • Paleoclimate • Couplings between changes in the climate system and biogeochemistry • Climate models and their evaluation • Understanding and attributing climate change • Global climate projections • Regional climate projections
WGI: Chapter 9 “Understanding and attributing climate change” • Coordinating Lead Authors • Gabriele Hegerl (USA) • Francis Zwiers (Canada) • Lead authors • Pascale Braconnot (France) • Nathan Gillett (Canada) • Yong Luo (China) • Jose Antonio Marengo (Brazil) • Neville Nicholls (Australia) • Joyce Penner (USA) • Peter Stott (United Kingdom) • Review editors • David Karoly (USA) • Laban Ogallo (Kenya) • Serge Planton (France)
WGI AR4 Schedule • May 2004: Author teams selected • September 2004: 1st Lead Author meeting, Trieste • February 2005: Informal review of preliminary draft • May 2005: 2nd LA meeting, Beijing • September 2005: External review of 1st draft begins • December 2005: 3rd LA meeting, Christchurch • April 2006: External and government review of 2nd draft • June 2006: 4th LA meeting, Bergen • October 2006: Final draft to governments - SPM review • February 2007: WGI plenary (Paris) approves/accepts documents
WGI: The Physical Science Basis >30,000 reviewer comments >6,000 references cited >900 pages 154 Lead Authors 11 chapters 5 meetings >3 years
We need to include human action in climate models, to simulate recent warming
The Australian misrepresents IPCC The Australian IPCC AR4 There is no clear trend in the annual numbers of tropical cyclones. It is more likely than not that anthropogenic influence has contributed to increases in the frequency of the most intense tropical cyclones. Stronger attribution is not possible at the moment because… • Research by hurricane scientists may force the UN climate panel to retract its claims that greenhouse gas emissions have caused an increase in the number of tropical storms • The benchmark 2007 report by the Intergovernmental Panel on Climate Change said an increase in cyclone force storms since 1970 was probably caused by climate change
The Australian misrepresents Knutson et al The Australian Knutson et al …future projections based on theory and high-resolution dynamical models consistently indicate that greenhouse warming will cause the globally averaged intensity of tropical cyclones to shift towards stronger storms, with intensity increases of 2-11% by 2100 …high resolution modelling studies typically project substantial increases in the frequency of the most intense cyclones • Cyclone climate link rejected
The Australian exaggerates differences between IPCC (2007) & Knutson et al (2010) Knutson et al (2010) IPCC AR4 (2007) It is likely that future tropical cyclones…will become more intense, with larger peak wind speeds ✓ less confidence in projections of a global decrease in numbers of tropical cyclones ✓ Likely that future tropical cyclones will [have]…more heavy precipitation ✓ It is more likely than not that anthropogenic influence has contributed to increases in the frequency of the most intense tropical cyclones [but….] • Some increase in the mean maximum wind speed of tropical cyclones is likely ✓ • It is likely that the global frequency of tropical cyclones will either decrease or remain essentially unchanged ✓ • Rainfall rates are likely to increase ✓ • …despite some suggestive observational studies, we cannot at this time conclusively identify anthropogenic signals in past tropical cyclone data
Comparison to IPCC (2007) Advertisement IPCC (2007) “very likely increase in frequency of hot extremes, heat waves and heavy precipitation” “very likely” means “>90% chance” • “Extreme weather events such as storms, floods and heatwaves will become more frequent and intense.”
On-line climate information resources • http://www.realclimate.org/ • http://www.climatedata.info/index.html • http://scienceblogs.com/deltoid/ • http://tamino.wordpress.com/ • http://www.youtube.com/user/greenman3610#p/u • http://www.skepticalscience.com/ • http://www.ipcc.ch