Download
1 / 20
210 likes | 440 Vues
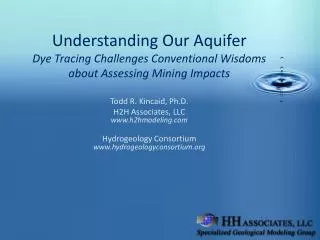
Understanding Our Aquifer Dye Tracing Challenges Conventional Wisdoms about Assessing Mining Impacts. Todd R. Kincaid, Ph.D. H2H Associates, LLC www.h2hmodeling.com Hydrogeology Consortium www.hydrogeologyconsortium.org. Mining Impacts: The Real Problem.

E N D
Understanding Our AquiferDye Tracing Challenges Conventional Wisdoms about Assessing Mining Impacts Todd R. Kincaid, Ph.D. H2H Associates, LLCwww.h2hmodeling.com Hydrogeology Consortiumwww.hydrogeologyconsortium.org
Mining Impacts: The Real Problem Topic Internet Hits • global water resources: 24,800,000 • aquifer protection: 1,350,000 • water shortage: 8,130,000 • water crisis: 27,900,000 • water pollution: 34,400,000 • bottled water: 10,100,000 • Florida springs: 40,900,000 • Quarry Impacts: 655,000 • Florida springs decline: 651,000 • Florida quarry impacts: 217,000 • Britney Spears: 49,800,000 • free porn: 188,000,000 • free sex: 366,000,000 Clean Water / Free Sex = < 10% Clean Water / Britney Spears = 68%
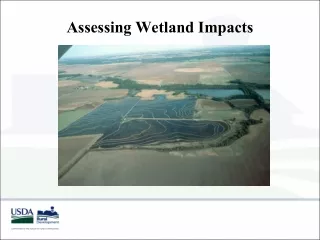
Purpose • Describe the basic hydrogeological principles on which mining impact assessments are based • Identify their assumptions and limitations • Describe why they often under-estimate impacts in karst aquifers • Provide examples of dye tracing in Florida • Show how tracer testing results are reshaping our understanding of the Floridan aquifer • Discuss the implications to mining impact assessments • Impacts can be classified broadly as water quality & water quantity
The Floridan Aquifer • 27 (>1/3) of the largest springs in North America discharge from the Floridan Aquifer • Average discharge from those springs > 6.5 billion gpd • All of those springs discharge from mapped underwater cave systems • >90% of inhabitants use groundwater from Floridan Aquifer • Conduit-dominated flow in unconfined sections • Less known under confining layer
Hydrologic Cycle How much groundwater do we have? • Water Budget • Sustainabletotal use = recharge • Surplus Storagetotal use < recharge • Declining Storagetotal use > recharge • Just like your check book • Water is in constant motion moving from rain to the sea. • Many different users (humans, plants, animals, rivers, streams, springs, estuaries, etc). • Groundwater withdrawals intercept part of that flow and return it along a different path (typically surface flow). • Quality & Quantity are impacted by how much we use, how we impact the quality of recharge, and how the water flows underground.
Aquifer make-up Most commonly assumed Most commonly true
Measuring Impacts - Quantity e.g. Mine Dewatering – most everywhere other than Florida Original Water Table Surface Cone of Depression Conditions that effect the shape of the COD Same for karst conduits Barrier Source
What is a karst aquifer? • A karst aquifer can be defined as any body of rock composed of soluble material through which groundwater flows and dissolves its own pathways. • Florida = karst • Rock is soluble • Lots of rain/recharge to dissolve rock • Springs • Sinkholes • Caves & conduits Indian Springs, Florida
Monitoring Impacts in Karst • Monitoring wells are most suited to porous media aquifers where flow is uniform through the rock. • Not as effective in karst aquifers where the bulk of the flow is carried by conduits because there is a low probability of intersecting them. • The data derived from monitoring wells is therefore not likely to reflect the “whole story.”
Well-Based Characterization Problems Wakulla Springs Basin – North Florida • Potentiometric surface map of the Woodville Karst Plain • Used to map groundwater flow directions and velocities • Produce very generalized estimations of groundwater flow directions • Under-estimate velocities • Misrepresent connections
What Gets Missed? • Swalletssinkholes that convey all or part of a streams flow into the aquifer • Springsthe largest concentration of the biggest springs in North America • Cavesthe longest underwater caves in North America • Connectionspredictions of slow velocities and broad diffusive flow patterns fail to map connections
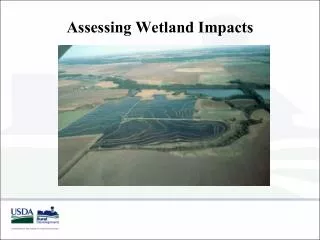
Problem: Water Quality Declines Increasing nitrate & nutrient levels promote algae and bacterial growth Most probable source of nitrates: Septic systems & Tallahassee Spray Field
Dye Tracing – Mapping Connections • What is Dye Tracing?
Dye Tracing – Mapping Connections Emerald Sink - River Sink 1200 m – 5.74 hrs 5100 m/day River Sink – Turner Sink 2270 m – 33.7 hrs 1620 m/day
Dye Tracing – Mapping Connections • 2002: Fisher Creek • 1.2 miles / 56 hours • 0.51 miles/day • 2003: Black Creek • 1.6 miles / 76 hours • 0.50 miles/day • 2004: Leon Sinks • 10.6 miles / 7.1 days • 1.2 miles/day • 2004 & 2005: Ames Sink • Indian: 4.95 mi./16 days • Sally: 5.35 mi./17.5 days • Wakulla: 5.8 mi./22 days 2006: SESF – Wakulla B-Tunnel, Indian, Sally Ward & McBrides / about 1.5 months
Changing Perceptions – Gets Results $160,000,000.00 Breakthrough Curve Dye from Tallahassee Sprayfield reaches Wakulla Spring Tracer arrives at Wakulla: ~60 days City agrees to invest $160M in waste water treatment upgrades
Karst in my County? • No caves? • No big springs? • No sinking streams? • Can still have conduit flow! • Quarries located close to Northern Miami-Dade well field • Potential source of contamination to the wells • Conventional wisdoms “models” state that groundwater travel times are slow (many days) • Dye tracing – on the other hand – showed that travel times are hours: 1.5 orders of magnitude! • Problem was that the trace was designed assuming the slower rate and as a result the wells were flooded with red dyed water turning people’s underwear pink • Lesson: limestone + rain = karst • Adequate protection measures must be based on accurate conceptualizations “models”