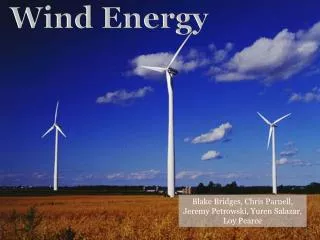
Wind Energy
Wind Energy. Stephen R. Lawrence Leeds School of Business University of Colorado Boulder, CO. Acknowledgement. Adapted from a presentation by Keith Stockton Environmental Studies University of Colorado Boulder, CO. Ancient Resource Meets 21 st Century.

Wind Energy
E N D
Presentation Transcript
Wind Energy Stephen R. Lawrence Leeds School of Business University of Colorado Boulder, CO
Acknowledgement Adapted from a presentation by Keith Stockton Environmental Studies University of Colorado Boulder, CO
Wind Energy Outline • History and Context • Advantages • Design • Siting • Disadvantages • Economics • Project Development • Policy • Future
Wind Energy History • 1 A.D. • Hero of Alexandria uses a wind machine to power an organ • ~ 400 A.D. • Wind driven Buddhist prayer wheels • 1200 to 1850 • Golden era of windmills in western Europe – 50,000 • 9,000 in Holland; 10,000 in England; 18,000 in Germany • 1850’s • Multiblade turbines for water pumping made and marketed in U.S. • 1882 • Thomas Edison commissions first commercial electric generating stations in NYC and London • 1900 • Competition from alternative energy sources reduces windmill population to fewer than 10,000 • 1850 – 1930 • Heyday of the small multiblade turbines in the US midwast • As many as 6,000,000 units installed • 1936+ • US Rural Electrification Administration extends the grid to most formerly isolated rural sites • Grid electricity rapidly displaces multiblade turbine uses
Increasingly Significant Power Source Wind could generate 6% of nation’s electricity by 2020. Wind currently produces less than 1% of the nation’s power. Source: Energy Information Agency
Manufacturing Market Share Source: American Wind Energy Association
Ponnequin – 30 MW • Operate with wind speeds between 7-55 mph • Originally part of voluntary wind signup program • Total of 44 turbines • In 2001, 15 turbines added • 1 MW serves ~300 customers • ~1 million dollars each • 750 KW of electricity each turbine • Construction began Dec ‘98 • Date online – total June 1999 • Hub height – 181 ft • Blade diameter – 159 ft • Land used for buffalo grazing
Advantages of Wind Power • Environmental • Economic Development • Fuel Diversity & Conservation • Cost Stability
Environmental Benefits • No air pollution • No greenhouse gasses • Does not pollute water with mercury • No water needed for operations
Pollution from Electric Power Source: Northwest Foundation, 12/97 Electric power is a primary source of industrial air pollution
Economic Development Benefits • Expanding Wind Power development brings jobs to rural communities • Increased tax revenue • Purchase of goods & services
Economic Development Example Case Study: Lake Benton, MN $2,000 per 750-kW turbine in revenue to farmers Up to 150 construction, 28 ongoing O&M jobs Added $700,000 to local tax base
Fuel Diversity Benefits • Domestic energy source • Inexhaustible supply • Small, dispersed design • reduces supply risk
Cost Stability Benefits • Flat-rate pricing • hedge against fuel price volatility risk • Wind electricity is inflation-proof
= 1/2 x air density x swept rotor area x (wind speed)3 A V3 Power in the Wind (W/m2) Density = P/(RxT) P - pressure (Pa) R - specific gas constant (287 J/kgK) T - air temperature (K) Area = r2 Instantaneous Speed (not mean speed) kg/m3 m2 m/s
Wind Energy Natural Characteristics • Wind Speed • Wind energy increases with the cube of the wind speed • 10% increase in wind speed translates into 30% more electricity • 2X the wind speed translates into 8X the electricity • Height • Wind energy increases with height to the 1/7 power • 2X the height translates into 10.4% more electricity
Wind Energy Natural Characteristics • Air density • Wind energy increases proportionally with air density • Humid climates have greater air density than dry climates • Lower elevations have greater air density than higher elevations • Wind energy in Denver about 6% less than at sea level • Blade swept area • Wind energy increases proportionally with swept area of the blades • Blades are shaped like airplane wings • 10% increase in swept diameter translates into 21% greater swept area • Longest blades up to 413 feet in diameter • Resulting in 600 foot total height
Betz Limit • Theoretical maximum energy extraction from wind = 16/27 = 59.3% • Undisturbed wind velocity reduced by 1/3 • Albert Betz (1928)
How Big is a 2.0 MW Wind Turbine? This picture shows a Vestas V-80 2.0-MW wind turbine superimposed on a Boeing 747 JUMBO JET
Wind Turbine Power Curve Vestas V80 2 MW Wind Turbine KW 10 20 30 40 50 MPH
2003 1.8 MW 350’ 2000 850 kW 265’ Recent Capacity Enhancements 2006 5 MW 600’
Nacelle Components 10 5 16 17 12 12 • Hub controller 11. Blade bearing • Pitch cylinder 12. Blade • Main shaft 13. Rotor lock system • Oil cooler 14. Hydraulic unit • Gearbox 15. Machine foundation • Top Controller 16. Yaw gears • Parking Break 17. Generator • Service crane 18. Ultra-sonic sensors • Transformer 19. Meteorological gauges • Blade Hub
Turbines Constantly Improving • Larger turbines • Specialized blade design • Power electronics • Computer modeling • produces more efficient design • Manufacturing improvements
100 80 60 % Available 40 20 0 Year 1981 '83 '85 '90 '98 Improving Reliability • Drastic improvements since mid-80’s • Manufacturers report availability data of over 95%
Wind Power Classes Wind speed is for standard sea-level conditions. To maintain the same power density, speed increases 3%/1000 m (5%/5000 ft) elevation.
Siting a Wind Farm • Winds • Minimum class 4 desired for utility-scale wind farm (>7 m/s at hub height) • Transmission • Distance, voltage excess capacity • Permit approval • Land-use compatibility • Public acceptance • Visual, noise, and bird impacts are biggest concern • Land area • Economies of scale in construction • Number of landowners
Market Barriers • Siting • Avian • Noise • Aesthetics • Intermittent source of power • Transmission constraints • Operational characteristics different from conventional fuel sources • Financing
Wind Energy and the Grid • Pros • Small project size • Short/flexible development time • Dispatchability • Cons • Generally remote location • Grid connectivity -- lack of transmission capability • Intermittent output • Only When the wind blows (night? Day?) • Low capacity factor • Predicting the wind -- we’re getting better
Birds - A Serious Obstacle • Birds of Prey (hawks, owls, golden eagles) in jeopardy • Altamont Pass – News Update – from Sept 22 • shut down all the turbines for at least two months each winter • eliminate the 100 most lethal turbines • Replace all before permits expire in 13 years
Wind – Characteristics & Consequences • Remote location and low capacity factor • Higher transmission investment per unit output • Small project size and quick development time • Planning mismatch with transmission investment • Intermittent output • Higher system operating costs if systems and protocols not designed properly
Balancing Supply & Demand 4500 Gas 4000 Gas/Hydro 3500 Base Load – Coal 3000
Wind Farm Design Economics • Key Design Parameters • Mean wind speed at hub height • Capacity factor • Start with 100% • Subtract time when wind speed less than optimum • Subtract time due to scheduled maintenance • Subtract time due to unscheduled maintenance • Subtract production losses • Dirty blades, shut down due to high winds • Typically 33% at a Class 4 wind site
Wind Farm Financing • Financing Terms • Interest rate • LIBOR + 150 basis points • Loan term • Up to 15 years