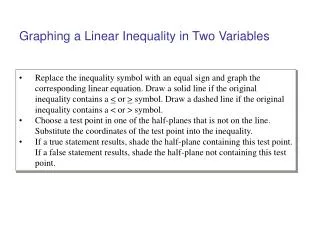
Graphing a Linear Inequality
Graphing a Linear Inequality. Graphing a linear inequality is very similar to graphing a linear equation. Graphing a Linear Inequality. 1) Solve the inequality for y (or for x if there is no y ). 2) Change the inequality to an equation and graph.

Graphing a Linear Inequality
E N D
Presentation Transcript
Graphing a Linear Inequality Graphing a linear inequality is very similar to graphing a linear equation.
Graphing a Linear Inequality • 1) Solve the inequality for y (or for x if there is no y). • 2) Change the inequality to an equation and graph. • 3) If the inequality is < or >, the line is dotted. If the inequality is ≤ or ≥, the line is solid.
Graphing a Linear Inequality • Graph the inequality 3 - x > 0 • First, solve the inequality for x. 3 - x > 0 -x > -3 x< 3
6 4 2 3 Graph: x<3 • Graph the line x = 3. • Because x < 3 and not x ≤ 3, the line will be dotted. • Now shade the side of the line where x < 3 (to the left of the line).
Graphing a Linear Inequality • 4) To check that the shading is correct, pick a point in the area and plug it into the inequality. • 5) If the inequality statement is true, the shading is correct. If the inequality statement is false, the shading is incorrect.
6 4 2 3 Graphing a Linear Inequality • Pick a point, (1,2), in the shaded area. • Substitute into the original inequality 3 – x > 0 3 – 1 > 0 2 > 0 • True! The inequality has been graphed correctly.
Graphing Linear Inequalities using the Casio Calculator • Go to the graph menu (5) • Delete all equations. • Before you enter your inequality, hit Type (F3), then F6. • Hit F1 - F4 to choose your inequality. • Now type in your inequality. • Hit F6 to graph.