Graphing Linear Equations: Lisa A. Heaton's Guide
Learn how to graph linear equations in all quadrants and axes with detailed instructions on plotting points, slopes, and intercepts. Perfect for beginners!


Graphing Linear Equations: Lisa A. Heaton's Guide
E N D
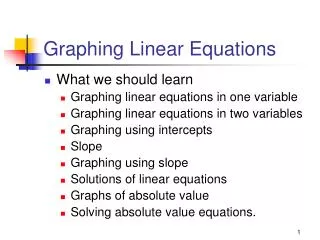
Presentation Transcript
Graphing Linear Equations Created by Lisa A. Heaton
Quadrants and Axes Y Quadrants I, II, III, IV Axis x and y II I X III IV
Quadrants (Plotting Points) II I (-X, +Y) (+X, +Y) (-X, -Y) (+X, -Y) III IV
Quadrants (Plotting Points) (3, 5) (-3, 5) (3, 5) (-3, 5) (-3, -5) (-X, +Y) (+X, +Y) (3, -5) (-X, -Y) (+X, -Y) (-3, -5) (3, -5)
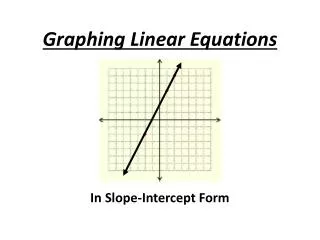
Linear Equations (y = mx + b) • b = y-intercept • plot (0,b) to get your first point • m = slope • written as a fraction slope = rise/run • Lean right if positive • Lean left if negative
Linear Equations (y = mx + b) b = 2 (y-intercept) plot (0,2) y = -1/2 x + 2 m = -1/2 (sloperise/run) negative leans left plot up 1, left 2 plot down 1, right 2 connect the points
Linear Equations (y = mx + b) b = -3 (y-intercept) plot (0,-3) y =1/3 x - 3 m = 1/3 (sloperise/run) positive leans right plot up 1, right 3 plot down 1, left 3 connect the points