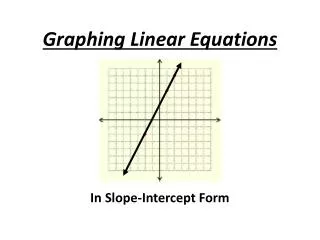
Graphing Linear Equations
This guide examines whether specific points fall on the graph of given linear equations. We analyze the equations (4x + 2y = 18) and (15x + 5y = 5) by substituting various ordered pairs and checking their validity. Additionally, we find three distinct solutions for the equations (y = 2x + 10) and (y = -x + 5). Finally, we rewrite the equation (4x + 2y = 20) in function form for better understanding and utilize a table of values to graph the equations (y = 4x - 1) and (y = -3x + 1).


Graphing Linear Equations
E N D
Presentation Transcript
Do the points fall on the graph of the line 4x + 2y = 18 a. 4(1) + 2(8) = 18 b. 4(3) + 2(3) = 18 a. (1,8) 4 + 16 = 18 12 + 6 = 18 b. (3,3) 20 = 18 18 = 18 No Yes 15x + 5y = 5 a. 15(-2) + 5(7) = 5 b. 15(-1) + 5(4) = 5 -30 + 35 = 5 -15 + 20 = 5 a. (-2,7) 5 = 5 5 = 5 b. (-1,4) Yes Yes
Find three different ordered pairs that are solutions y = 2x + 10 y = -x + 5 (1,12) (0,10) (-1,8) (1,4) (0,5) (-1,6)
Rewrite the equation in function form 4x + 2y = 20 5x + y = -5 -4x -4x -5x -5x 2y = -4x +20 y = -5x - 5 2 2 y = -2x +10
Use a table of values to graph the equation y = 4x - 1 y = -3x + 1