Graphing Linear Equations
Chapter 4. Graphing Linear Equations. Chapter Sections. 4.1 – The Cartesian Coordinate System and Linear Equations in Two Variables 4.2 – Graphing Linear Equations 4.3 – Slope of a Line 4.4 – Slope-Intercept and Point-Slope Forms of a Linear Equation.


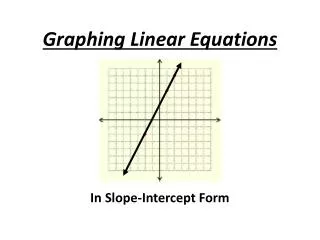
Graphing Linear Equations
E N D
Presentation Transcript
Chapter 4 Graphing Linear Equations
Chapter Sections 4.1 – The Cartesian Coordinate System and Linear Equations in Two Variables 4.2 – Graphing Linear Equations 4.3 – Slope of a Line 4.4 – Slope-Intercept and Point-Slope Forms of a Linear Equation
The Cartesian Coordinate System and Linear Equations in Two Variables § 4.1
Definitions A graphshows the relationship between two variables in an equation. The Cartesian (rectangular) coordinate systemis a grid system used to draw graphs. It is named after its developer, René Descartes (1596-1650).
Definitions y x II I III IV The two intersecting axis form four quadrants,numbered I through IV. The horizontal axis is called the x-axis. The vertical axis is called the y-axis.
Definitions y x Origin (0, 0) The point of intersection of the two axes is called the origin. The coordinates, or the value of the x and the value of the y determines the point. This is also called an orderedpair.
Plotting Points Starting at the origin, move 3 places to the right. Plot the point (3, –4). The x-coordinate is 3 and the y-coordinate is –4.
Plotting Points Then move 4 places down. Plot the point (3, –4). The x-coordinate is 3 and the y-coordinate is –4.
Plotting Points (3, -4) Plot the point (3, –4). The x-coordinate is 3 and the y-coordinate is –4.
Linear Equations A linear equation in two variablesis an equation that can be put in the form ax + by = c where a, b, and c are real numbers. This is called the standard formof an equation. Examples: 4x – 3y = 12 x + 2y = – 35
Solutions to Equations The solutionto an equation is the ordered pair that can be substituted into the equation without changing the “validity” of the equation. Is (3, 0) a solution to the equation 4x – 3y = 12? 4x – 3y = 12 4(3) – 3(0) = 12 12 – 0 = 12 12 = 12 Yes, it is a solution.
Graphing A graphof an equation is an illustration of a set of points whose coordinates satisfy the equation. A set of points that are in a straight line are collinear. The points (–1, 4), (1, 1) and (4, –3) are collinear.
Graph by Plotting Points • Solve the linear equation for the variable y. • Select a value for the variable x. Substitute this value in the equation for x and find the corresponding value of y. Record the ordered pair (x,y). • Repeat step 2 with two different values of x. This will give you two additional ordered pairs. • Plot the three ordered pairs. • Draw a straight line through the points.
Graph by Plotting Points Graph the equation y = –x + 3. y = –2 + 3 y = 1 Let x = 2 This give us the point (2, 1). y = –(-2) + 3 y = 5 Let x = -2 This give us the point (-2, 5). y = –1 + 3 y = 2 Let x = 1 This give us the point (1, 2). Plot the points and draw the line.
Graph by Plotting Points Plot the points (2, 1), (-2, 5), and (1, 2). Draw the line.
Graph Using Intercepts • Find the y-intercept by setting x in the equation equal to 0 and finding the corresponding value of y. • Find the x-intercept by setting the y in the equation equal to 0 and finding the corresponding value of x. • Determine a check point by selecting a nonzero value for x and finding the corresponding y. • Plot the two intercepts and the check point. • Draw a straight line through the points.
Graph Using Intercepts y = This gives us the point (2, ). Graph the equation -3y –2x = -6. -3y –2(0) = -6 y = 2 Let x = 0 This gives us the y-intercept (0, 2). -3(0) –2x = -6 x = 3 Let y = 0 This gives us the x-intercept (3, 0). -3y – 2(2) = -6 -3y = -2 Let x = 2 Plot the points and draw the line.
Graph by Plotting Points Plot the points (0, 2), (3, 0), and (2, ). Draw the line.
Slope of a Line § 4.3
Slope The slope of a lineis the ratio of the vertical change between any two selected points on the line. Consider the points (3, 6) and (1,2).
Slope Vertical Change Horizontal Change (3, 6) and (1,2) This means the graph is moving up 4 and to the right 2.
Slope Simplifying, , so m = 2 Vertical Change Horizontal Change m = 2
Positive & Negative Slopes y y x x Positive Slope Negative Slope Line rises from left to right Line falls from left to right
Horizontal Lines x = 2 Every horizontal like has a slope of 0.
Vertical Lines y = -4 The slope of any vertical line is undefined.
Parallel Lines Two non-vertical lines with the same slope and different y-intercepts are parallel . Any two vertical lines are parallel to each other. m1 = m2
Perpendicular Lines m1 = -1 m2 Two lines whose slopes are negative reciprocals of each other are perpendicular lines. Any vertical line is perpendicular to any horizontal line.
Slope-Intercept Form slope y-intercept y-intercept is (0, -4) slope is 3 y-intercept is (0, ) slope is In the slope-intercept form, the graph of a linear equation will always be a straight line in the form y = mx+ bwere m is the slope of The line and b is the y-intercept (0, b). y = mx+ b Examples: y = 3x– 4 y = x+
Slope-Intercept Form y-intercept is (0, -) slope is Write the equation 6x = 8y + 7 in slope-intercept form. Solve for y. 6x = 8y + 7 – 8y = – 6x +7 y = x – y = x –
Point-Slope Form When the slope and a point on the line are known, we can use thepoint-slope form to determine the line. where m is the slope of the line and (x1, y1) is a point. Example: point (2, 3) and slope = 4: