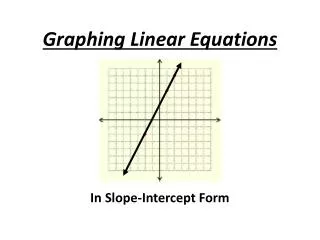
Graphing Linear Equations
In this unit, students will learn to graph linear equations in slope-intercept form (y = mx + b). They will understand key concepts such as slope (the "rise over run") and y-intercept (the starting point on the graph). Through step-by-step examples, students will practice plotting points based on given equations and interpreting unit rates. This comprehensive guide equips learners to identify and depict the relationship between variables effectively and to visualize positive and negative slopes using real-world scenarios.


Graphing Linear Equations
E N D
Presentation Transcript
Graphing Linear Equations Unit 5.08 I can graph linear equations in slope-intercept form. I can also identify and interpret the unit rate and starting point from a graph!
Put it all together! Unit Rate Constant Rate of Change Change in y Change in x Rise Run SLOPE!
Vocabulary Slope:The“rise over run”, describes the steepness of a line. In mathematics, we use the variable m to represent slope.
Put it all together! Starting Point Y-Intercept!
Vocabulary Slope:The“Rise over Run”, describes the steepness of a line. In mathematics, we use the variable m to represent slope. Y-Intercept:Where the graph of a line crosses the y-axis. In mathematics, we use the variable b to represent the y-intercept.
Vocabulary (Review) Slope Intercept Form:A linear equation written in the form y = mx + b. dd * The slope (or unit rate) of the line is m. * The y-intercept (or starting point) is b. Example: In the equation y = ½x + 3, the slope is½and the y-intercept is3. Let’s graph this equation!
1) y = mx + b Step 1: If we know that the y-intercept (starting point) is 3, then we can plot the point (0, 3) on the graph. Step 2: From that point, we count the “rise over run” (unit rate) of the slope to find other points on the line. Step 3: Connect the dots.
2) y = mx + b Step 1: If we know that the y-intercept (starting point) is -5, then we can plot the point (0, -5) on the graph. Step 2: From that point, we count the “rise over run” (unit rate) of the slope to find other points on the line. Step 3: Connect the dots.
3) y = mx + b Step 1: If we know that the y-intercept (starting point) is 0, then we can plot the point (0, 0) on the origin of the graph. Step 2: From that point, we count the “rise over run” (unit rate) of the slope to find other points on the line. Step 3: Connect the dots.
The examples so far have all had positive slope. What would the graph of a line with negative slope look like?
4) y = mx + b Step 1: If we know that the y-intercept (starting point) is 2, then we can plot the point (0, 2) on the graph. Step 2: From that point, we count the “rise over run” (unit rate) of the slope to find other points on the line. Step 3: Connect the dots.
5) y = mx + b Step 1: If we know that the y-intercept (starting point) is 6, then we can plot the point (0, 6) on the graph. Step 2: From that point, we count the “rise over run” (unit rate) of the slope to find other points on the line. Step 3: Connect the dots.
Try These! 6) 7)
Homework Time! 5.08 Graphing Linear Equations WS I can graph linear equations in slope-intercept form. I can also identify and interpret the unit rate and starting point from a graph!