Graphing Linear Equations
Learn how to graph linear equations using the slope-intercept form (y = mx + b). This guide provides step-by-step instructions on plotting points using a table of x-values, determining the y-intercept, and identifying the slope. Understand key concepts such as rise over run and how to graph equations by visualizing the slope and intercept on the coordinate plane. Examples are included to illustrate the process, ensuring you grasp the fundamental principles of graphing linear equations effectively.

Graphing Linear Equations
E N D
Presentation Transcript
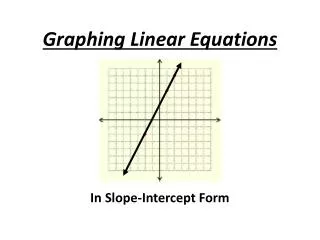
Graphing Linear Equations In Slope-Intercept Form
In order to graph using point plotting, you will need to create a table. You will need to choose at least 3 numbers for x and “plug” them into the equation to find corresponding y values. Plot the points For Example: Graph y = 2x - 1 x y Choose x values -1 2(-1)-1=-3 0 2(0)-1 = -1 1 2(1)-1 = 1 “plug” x into the equation
Graph using point plotting x y (-2) + 3 = 2 -2 0 2 (0) + 3 = 3 (2) + 3 = 4
These equations are all in Slope-Intercept Form: Notice that these equations are all solved for y.
Just by looking at an equation in this form, we can draw the line (no tables). • The constant is the y-intercept. • The coefficient is the slope. Constant = 1, y-intercept = 1. Coefficient = 2, slope = 2. Constant = -4, y-intercept = -4. Coefficient = -1, slope = -1. Constant = -2, y-intercept = -2. Coefficient = 3/2, slope = 3/2.
The formula for Slope-Intercept Form is: • ‘b’ is the y-intercept. • ‘m’ is the slope. On the next three slides we will graph the three equations: using their y-intercepts and slopes.
right 1 up 2 right 1 up 2 1) Plot the y-intercept as a point on the y-axis. The constant, b = 1, so the y-intercept = 1. 2) Plot more points by counting the slope up the numerator (down if negative) and right the denominator. The coefficient, m = 2, so the slope = 2/1.
down 1 down 1 right 1 right 1 1) Plot the y-intercept as a point on the y-axis. The constant, b = -4, so the y-intercept = -4. 2) Plot more points by counting the slope up the numerator (down if negative) and right the denominator. The coefficient, m = -1, so the slope = -1/1.
right 2 up 3 right 2 up 3 1) Plot the y-intercept as a point on the y-axis. The constant, b = -2, so the y-intercept = -2. 2) Plot more points by counting the slope up the numerator (down if negative) and right the denominator. The coefficient, m = 3/2, so the slope = 3/2.
Sometimes we must solve the equation for y before we can graph it. The constant, b = 3 is the y-intercept. The coefficient, m = -2 is the slope.
down 2 down 2 right 1 right 1 1) Plot the y-intercept as a point on the y-axis. The constant, b = 3, so the y-intercept = 3. 2) Plot more points by counting the slope up the numerator (down if negative) and right the denominator. The coefficient, m = -2, so the slope = -2/1.
Important!!! This is one of the big concepts in Algebra. You need to thoroughly understand this! Slope – Intercept Form y = mx + b m represents the slope b represents the y-intercept
To graph a linear equation, you will need to find the slope and the y-intercept for the equation. Remember: y = mx + b slope Y-intercept (the point where the graph crosses the y-axis)
Slope = Y-intercept = Graph 1. Plot the y-intercept • Use the slope to find • the next point • Slope = “rise over run”
Graph 2x + 5y = 10 using the slope-intercept form: (put the equation in slope-intercept form first) 2x + 5y = 10 5y = 10 – 2x y = 2 – 2/5 x slope = -2/5 y – intercept = 2 A negative slope means you will go down then right from the y-intercept