Download
1 / 46
460 likes | 607 Vues
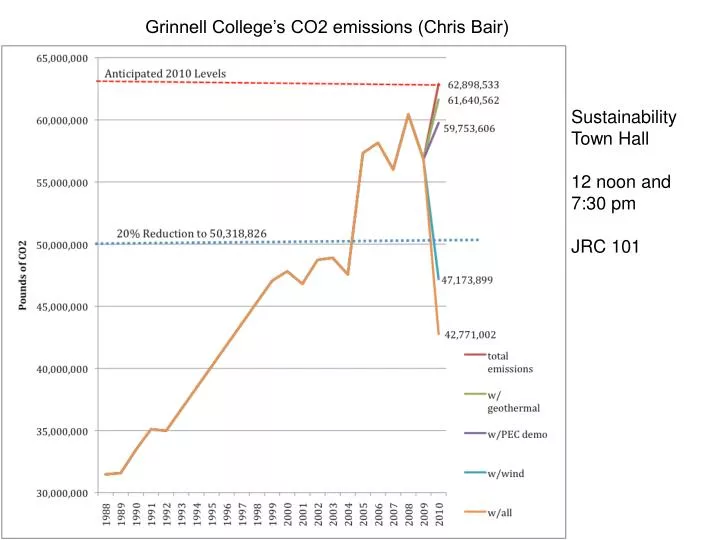
Grinnell College’s CO2 emissions (Chris Bair). Sustainability Town Hall 12 noon and 7:30 pm JRC 101. Figure 4.4 Effectiveness of different visual stimuli in triggering the begging behavior of young herring gull chicks. Tinbergen and Perdeck 1950. Figure 4.6 A chemical code breaker.

E N D
Grinnell College’s CO2 emissions (Chris Bair) Sustainability Town Hall 12 noon and 7:30 pm JRC 101
Figure 4.4 Effectiveness of different visual stimuli in triggering the begging behavior of young herring gull chicks
Figure 4.12 Properties of the ultrasound-detecting auditory receptors of a noctuid moth
Figure 4.15 Is the A2 cell necessary for anti-interception behavior by moths? (Part 1)
Figure 4.15 Is the A2 cell necessary for anti-interception behavior by moths? (Part 2)
Figure 4.16 The tympanum of the moth Noctua pronuba vibrates differently in response to a low-intensity ultrasound stimulus (shown in green) than to a high-intensity ultrasound (shown in orange)
Figure 4.17 Avoidance of and attraction to different sound frequencies by crickets
Figure 4.21 The central pattern generator of Tritonia in relation to the dorsal ramp interneurons (DRI)
Figure 4.26 The star-nosed mole’s nose differs greatly from that of the eastern mole and even more from those of its distant relatives
Figure 4.28 The cortical sensory map of the star-nosed mole’s tactile appendages is disproportionately weighted toward appendage 11
Figure 4.31 Ultraviolet-reflecting patterns have great biological significance for some species
Figure 4.32 Ultraviolet reflectance from male stickleback bodies influences female mate preferences
Figure 4.35 Socially relevant movements of the lips, mouth, hands, and body activate neurons in different parts of the superior temporal sulcus in the human brain
Figure 4.36 A special-purpose module in the human brain: the face recognition center
Figure 4.37 Specialization of function in different parts of the visual cortex of humans
Figure 4.40 The ability to navigate over unfamiliar terrain requires both a compass sense and a map sense (Part 1)
Figure 4.40 The ability to navigate over unfamiliar terrain requires both a compass sense and a map sense (Part 2)
Figure 4.41 Clock shifting and altered navigation in homing pigeons
Figure 4.43 Experimental manipulation of the biological clock changes the orientation of migrating monarchs
Figure 4.45 Polarized light affects the orientation of monarch butterflies


![G8 - SIGNALS AND EMISSIONS [2 exam questions - 2 groups]](https://cdn0.slideserve.com/1199451/g8-signals-and-emissions-2-exam-questions-2-groups-dt.jpg)