Download
1 / 30
300 likes | 416 Vues
This project examines the influence of North Atlantic Ocean climate variability on urban heat islands (UHI) and related heat stress exposure in three case study cities: Berlin, Antwerp, and Almada. Focusing on urban planning and health impacts, the project employs predictive tools to assess vulnerability based on climatic, demographic, and socio-economic factors. It includes stakeholder engagement to demonstrate how climate change can affect urban environments. The aim is to provide actionable insights for better urban planning and mitigate heat stress risks for vulnerable populations.

E N D
North Atlantic Ocean climate variability and its impact on heat stress exposure in urban areas: case studies and user requirements Catherine Stevens, Project manager and GIS expert, GIM
Agenda • UHI and mapping heat impact on health: brief reminder • Selection of 3 end users: short description • June 2013 - 1st end user: Berlin and Antwerp • September 2013 - Meeting the 3rd end user: Almada • Work in progress and planning
Agenda • UHI and mapping heat impact on health: brief reminder • Selection of 3 end users: short description • June 2013 - 1st end user : Berlin and Antwerp • September 2013 - Meeting the 3rd end user : Almada • Work in progress and planning
UHI and mapping heat impact on health city selection CMIP5 socio-economic observations UrbClim UHI prediction health effects heat stress exposure stratified by population, housing conditions, etc…
UHI and mapping heat impact on health • Heat stress High temperatures and humidity stress the body's ability to cool itself, and heat illness becomes a special concern during hot weather. • Some factors increase the risk of heat stress • Old people • Single • Sick • Being hospitalized • … • Heat stress depends on several factors
UHI and mapping heat impact on health • Climatic parameters • Temperature (e.g. apparent max t°) and humidity • Temperature variability (day max t°, night min t°, interval, duration) • Wind speed and direction… • Urban morphology parameters • City centre vs residential area • Green area and water place • Open space, street canyon • Buildings variables (material, albedo, orientation…)… • Demographic, socio-economic and healthparameters • Age and gender • Marital Status • Economic status and educational level • Health conditions, medication and disease…
UHI and mapping heat impact on health Results of Urban Heat Island model + Exposure indicators (Climatic, Urban morphology, Demographic / Socio-economic, Health) Exposure Maps
UHI and mapping heat impact on health • Indoor thermal condition in urban heat island – development of a predictive tool, Parham A. Mirzaeia, Fariborz Haghighata
UHI and mapping heat impact on health • Map of the statistical district of Melbourne showing the weighted vulnerability index for each postal area, on hot days • Combined demographic, socioeconomic, health, environmental variables vulnerability index http://www.hindawi.com/journals/ijpr/2012/518687
Agenda • UHI and mapping heat impact on health: brief reminder • Selection of 3 end users: short description • June 2013 - 1st end user : Berlin and Antwerp • September 2013 - Meeting the 3rd end user : Almada • Work in progress and planning
Selection of 3 end users • Selection of number of relevant stakeholders • Interested in benefiting from an analysis of the impacts of climate change on their urban dimension Three European cities • Antwerp (BE) • Berlin (DE) • Almada(PT)
Selection of 3 end users • Antwerp (BE) • Major port • Population density 2,500/km2 • 20% green and blue urban areas • Maritime temperate climate • Berlin (DE) • Metropolis counting 3.5 million inhabitants • Population density 3,700/km2 • 20-29 % green and blue urban areas • Warm-Summer Continental climate • Almada (PT) • Small city densely populated • Nearby Lisbon metropolis • Population density is 2,355 / km2 • Mediterranean climate and close to Atlantic ocean
Agenda • UHI and mapping heat impact on health: brief reminder • Selection of 3 end users: short description • June 2013 - 1st end user : Berlin and Antwerp • September 2013 - Meeting the 3rd end user : Almada • Work in progress and planning
June 2013 - 1st end user : Berlin and Antwerp • Themes and services identified • Scenario linked to urban planning: the effect of UHI today and in the future on urban planning • Scenario using existing urban plans/projects • Impacts of green roofs linked to green roof potential map/plan (2030-2040) • Impacts of change albedo (reflectivity) of buildings (roofs…) • … • Scenario using projected population figures • Densification population and new settlements • Vulnerable population (school and old people) • … • Impact of city expansion on climate change (e.g. projected LULC)
June 2013 - 1st end user : Berlin and Antwerp • Time frame to be used in simulation are • Current situation (2000-2010) • Mid term (2030-2040) • Long term prediction (2100) • Resolution vs extent • Larger extent (full city) with 250 m resolution • Smaller extent (part of city) with 100 m resolution • Seasonal studies • Summer • “Winter”
Agenda • UHI and mapping heat impact on health: brief reminder • Selection of 3 end users: short description • June 2013 - 1st end user : Berlin and Antwerp • September 2013 - Meeting the 3rd end user : Almada • Work in progress and planning
September 2013 : Almada end user workshop • Themes and services identified • Identify hotspots in city • Population exposure to heat waves • For ex. Last summer heat wave (2013) • Prediction/projection for 2100 as a help to downscale adaptation • Possible to identify 3 spots in the city for high resolution study to make diagnose out of the scope of NACLIM
September 2013 : Almada end user workshop • Almada meteorological station visit
Agenda • UHI and mapping heat impact on health: brief reminder • Selection of 3 end users: short description • June 2013 - 1st end user: Berlin and Antwerp • September 2013 - Meeting the 3rd end user: Almada • Work in progress and planning
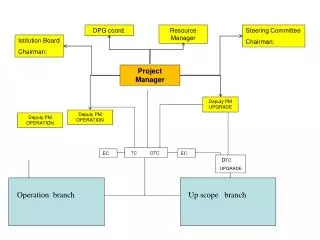
Work in progress • UHI modelling: UrbClim pre-processing input data • Variables/parameters • Current work : • Planar area Index (PAI): proportion of area covered by buildings per grid cell • Frontal area indexes (FAI): area of buildings projected into the plane normal to the incoming wind direction and is a function of orientation per grid cell • Average building height weighted with the building area and its variance • Sky view factor (SVF) • Outstanding work:% urban land use, land use type, % vegetation …
Work in progress • Berlin end-user case • Available data • 3D building layers • Street network • Study extent = Vito grid • Not full building coverage • Extrapolation of PAI and FAI Evaluation of relationship at 1km resolution between EEA SS and PAI/FAI
Work in progress • PAI and EEA SS
Work in progress • EEA SS and PAI Relationship
Work in progress • FAI and EEA SS
Work in progress • EEA SS and PAI Relationship
Work in progress • PAI Extrapolation on the full coverage
Questions? Don’t hesitate to ask! GIM nv/sa Researchpark Haasrode 1505 Interleuvenlaan 5 B-3001 Leuven (Heverlee) tel: +32 16 40 30 39 fax: +32 16 40 69 39 e-mail: info@gim.be website: www.gim.be
The research leading to these results has received funding from the European Union 7th Framework Programme (FP7 2007-2013), under grant agreement n.308299 NACLIM www.naclim.eu