Greenland Ice Sheet melting and MOC
120 likes | 316 Vues
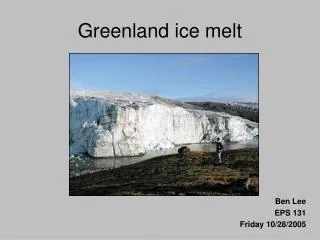
Greenland Ice Sheet melting and MOC. Aixue Hu, Gerald A. Meehl, Weiqing Han and Jianjun Yin. Introduction:. Thomas et al., 2006. Konrad Steffen and Russell Huff, 2005. Luthcke et al., 2006. How fast can Greenland Icesheet melt away?.

Greenland Ice Sheet melting and MOC
E N D
Presentation Transcript
Greenland Ice Sheet melting and MOC Aixue Hu, Gerald A. Meehl, Weiqing Han and Jianjun Yin
Introduction: Thomas et al., 2006 Konrad Steffen and Russell Huff, 2005 Luthcke et al., 2006
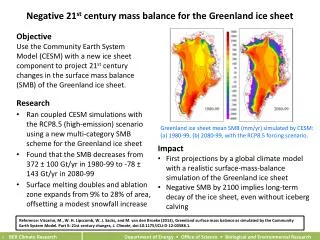
How fast can Greenland Icesheet melt away? 0 2.7 4.6 5.8 6.5 6.8 Sea Level (m) 2 mm/yr 4.5 mm/yr 3.2 mm/yr 1.2 mm/yr 0.5 mm/yr 4XCO2 PI, Ridley et al., 2005 Alley et al., 2005
Model and Experiments • CAM3 with T42 horizontally and 26 levels vertically • POP with 1 degree horizontally and 40 levels vertically • CSIM5 • CLM3 • Climate forcing: A1B Experiments: Four simulations: 1, standard A1B; 2. A1B with 0.01 Sv Greenland melting flux only added in summer months (May-Oct) which is increasing 1% per year till 2100; 3. same as 2, but 3% per year; 4. same as 2, but 7% per year till 2050, then kept constant afterwards.
Results: • MOC could weaken additionally by 9-25% if Greenland melting greater than 0.05Sv. • MHT reduces as MOC weakens further
Global mean surface temperature changes are very small in the 1%exp and 3%exp, and only cools by a few 10th degree in 7%exp by the end of the 21st century. • Sea ice cover in the southern hemisphere is similar in all experiments. In the Northern Hemisphere, sea ice cover increases only in the 7%exp
The global mean surface temperature warms by 2.43oC by the end of the 21st century relative to late 20th century. The warming in Arctic region is more than 8oC.
Surface temperature anomaly between GIS runs and A1B In the 1%exp, there is no significant global mean surface temperature change relative to A1Bexp. In the 3%exp, more significant cooling shows up in the northern North Atlantic region by up to 1oC relative to A1Bexp. In the 7%exp, the surface cooling is more than 3oC in some areas of the Arctic and subpolar North Atlantic relative to A1Bexp.
Changes of the dynamic sea level The dynamic sea level rises at the edges of the Atlantic and deepens in the central subpolar North Atlantic, indicating a spinup of the subpolar gyre. The further slowdown of the MOC could additionally raise the sea level in the North America coast region by up to 30cm by the end of the 21st century relative to the A1Bexp.
Summary • Result shows that an ice sheet melting with a rate up to 0.03 Sv would not alter MOC much in comparison to the simulation without prescribed Greenland Ice Sheet melting. A melting rate exceeding 0.05 Sv would further weaken the MOC by 9-24% by the end of the 21st century. • This weakened MOC doesn’t make the late 21st century global climate cooler than the late 20th century, but does cause the climate up to a few degrees less warm in the northern high latitudes • the rise of the DSL related to the further slowdown of the MOC added to the sea level rise caused by greenhouse gas induced warming could pose potential impacts on the northeast coast of the America.