Download
1 / 43
440 likes | 601 Vues
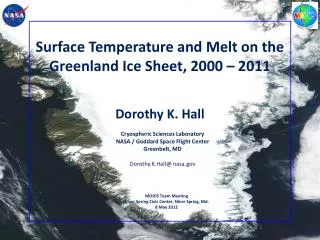
Surface Temperature and Melt on the Greenland Ice Sheet, 2000 – 2011 . Dorothy K. Hall. Cryospheric Sciences Laboratory NASA / Goddard Space Flight Center Greenbelt, MD

E N D
Surface Temperature and Melt on the Greenland Ice Sheet, 2000 – 2011 Dorothy K. Hall Cryospheric Sciences Laboratory NASA / Goddard Space Flight Center Greenbelt, MD Dorothy.K.Hall@ nasa.gov MODIS Team Meeting Silver Spring Civic Center, Silver Spring, Md. 8 May 2012
Collaborators Josefino C. Comiso Cryospheric Sciences Laboratory NASA / Goddard Space Flight Center, Greenbelt, Md. Nicolo E. DiGirolamo SSAI, Lanham, Md. Christopher A. ShumanUMBC / JCET, Baltimore, Md.
Outline • Introduction to the Cryosphere • Climate warming at high latitudes • Greenland surface temperature and melt from MODIS
NASA’s Earth Observing System (EOS) • VIIRS • LDCM
The Cryosphere • Seasonal snow cover • Mountain glaciers • Ice sheets • Frozen lakes • Sea ice • Permafrost North Pole . Greenland United States NASA Visible Earth
Evidence of Climate Warming has been Dramatic in the High Latitudes of the Northern Hemisphere • In the Northern Hemisphere there has been a decrease in: • Duration of lake ice over the last 150 years • Extent of sea ice since 1979 • Extent of snow cover since 1966 • Permafrost is warming and thawing in many areas • Small glaciers are shrinking (globally) • Melt on the Greenland Ice Sheet has been accelerating Source: NSIDC Klaus Thymann Photo by Kimberly Casey/NASA
Satellite Snow-Cover Products Feb. 2004 28 Dec. 2010 MODIS monthly snow-cover map Northeastern U.S. MODIS swath fractional snow-cover map National Ice Center (NIC) snow-cover map IMS 12 Feb. 2012
Northern Hemisphere Snow Cover Anomalies – Departure from 30-year Mean Northern Hemisphere snow-cover record; snow cover extent has decreased by ~10% since the record began, mainly due to earlier melt of spring snow cover Data courtesy Dave Robinson / Rutgers Univ. Figure from Hall & Foster, 2007, Our Changing Planet, King et al. (eds.)
Snow-covered area derived from station data (before 1972) and NOAA satellite data (after 1972); the smooth curve shows decadal variations (updated from Brown, 2000)
Small Glaciers and Ice Caps have been Shrinking Globally, glaciers have been receding since ~1850; recession has accelerated in the last quarter century Photo by Kimberly Casey/NASA
Glacier National Park, Montana Grinnell Glacier Recession* 193819812005 Salamander Glacier T.J. Hileman Carl Key (USGS)BlaseReardon (USGS) Since 1900 there has been an increase of ~1°C average summer temperature *Not all of the glaciers in GNP are retreating at this high rate
The European Alps • 50% loss of glacier volume from ~1850 to 1975, another 25% between 1975 to 2000; an additional 10 – 15% from 2000 to 2005
Historical Length Variations of the PasterzeGlacier, Austria Landsat era From Zhuo and Oerlemans (1997)
4-m resolution Ikonos image of the Pasterze Glacier in 2001 2000 2001 22,096±46m2 decrease in area of the terminus From Hall et al., 2003
AVHRR IR satellite observations show Arctic warming The surface temperature of the Arctic above 60N has been increasing at an average of ~0.72± 0.20C per decade, from 1981 to 2007 (updated from Comiso, 2006) http://visibleearth.nasa.gov
Greenland • Largest island on Earth (81% covered by ice) • Ice sheet is 1.7 million sq km • in area or 2.6 cubic km in volume September 26, 2011 - Southern Greenland MODIS Rapid Response Team – image of the day
About 19 Washington Monuments would fit into the Greenland Ice Sheet at its thickest part Contains ~8% of all of the Earth’s fresh water The ice sheet has a maximum thickness of ~3.3 km (2 mi.) Photograph by Jason Box / OSU
Photo credit: K. Hansen • Airborne Topographic Mapper (ATM) and ICESat laser altimetry data show greater thinning at the margins of the Greenland Ice Sheet (Krabill et al., 1999), below ~2000 m in elevation • Rate of thinning at margins has increased from increased melting and acceleration of outlet glaciers (Zwally et al., 2011) ICESat satellite
ICESat – Derived Changes in the Elevation of the Greenland Ice Sheet between 2003 and 2006 Increased melting and faster glacier flow lowered the surface along the margins of the ice sheet (blue), while increased snowfall thickened the ice in the interior of Greenland (pink) http://icesat.gsfc.nasa.gov/
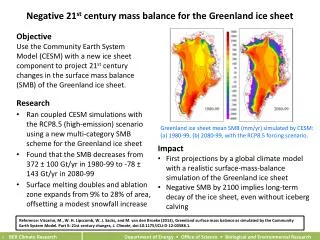
Increases in mass loss of the Greenland Ice Sheet have been documented in recent years using GRACE* satellite data From 2002 to the present, GRACE gravimetry data show mass loss below 2000 m elevation, and no change (or slight gain in mass) above 2000 m Figure courtesy of Scott Luthcke NASA/GSFC No data *Gravity Recovery & Climate Experiment
Glaciers, such as the Petermann Glacier along the island’s northern margin, drain the interior, returning this water to the sea as icebergs. Meltwater can accelerate the flow of a glacier by lubricating the underside as it scrapes over the rocky terrain. Despite Greenland’s remoteness, large-scale changes to the island’s ice sheet will have global influence. (NASA image by Jesse Allen and Robert Simmon.) Emanating from the periphery of the ice sheet are many smaller ice streams and outlet glaciers that drain the main ice sheet and release icebergs into the ocean MODIS image 5 July 2003 Earth Observatory
Retreat of Jakobshavn Glacier, SW Greenland 18 June 2003 MISR image from NASA/Earth Observatory http://earthobservatory.nasa.gov/IOTD/view.php?id=5086 NASA/USGS image courtesy of the Science Visualization Studio, at GSFC
Surface Temperature and Melt To monitor trends in surface temperature and melt extent on the Greenland Ice Sheet • To establish the uncertainties of mapping ice-surface temperature (IST) and surface melt extent from space
Ice Sheet Surface Temperature, or Ice-Surface Temperature (IST) • Surface temperatures are needed to • Estimate radiative fluxes; • For input to models to calculate the ice sheet contribution to sea-level rise; • Temperature is a physical quantity that can be compared directly with model results of skin temperature, conversely many different algorithms can be developed from the same passive- or active-MW data and they can provide different results; • Studies disagree on the amount and rate of warming, and increases in melt extent on the Greenland Ice Sheet – knowledge of IST can help reduce those uncertainties.
MOD29 Ice-Surface Temperature (IST) • MOD29 is the IST standard Terra MODIS data product • Ts = a + bT11 + c(T11 – T12) + d [(T11 – T12) (sec θ – 1)] • Where Ts = surface temperature; T11 and T12 are satellite-measured surface temperatures in MODIS bands 31(11µm) and 32 (12 µm); θ is sensor scan angle and a, b, c & d are regression coefficients. Increased difference between bands 31 & 32 is related to atmospheric attenuation (Hall et al., 2004). • This “split-window” technique is based on the Key & Haefliger (1992) and Key et al. (1997) algorithm developed for the AVHRR, but uses different coefficients for MODIS • ±1-4K accuracy (Hall et al., 2004 & Koenig and Hall, 2010) • MOD29 ice-surface temperature map of sea ice in the Arctic Ocean
MODIS: • Land-Surface Temperature (LST), MOD11 or MYD11 (Wan et al., 2002) • Ice-Surface Temperature (IST), MOD29 or MYD29 (based on Key et al., 1997 algorithm initially developed for use with AVHRR) Algorithms are similar and results compare well under winter conditions, but can diverge during the summer over the ice sheet.
MODIS Ice-Surface Temperature (IST) Environmental Science Data Record (ESDR) • Developed an IST ESDR of the Greenland Ice Sheet using MODIS Terra and Aqua data, • Daily and monthly maps (downloadable online at: http://modis-snow-ice.gsfc.nasa.gov/) • 6.25-km spatial resolution • Uncertainty information in each grid cell • Suitable for continuation using the Visible/Infrared Imager Radiometer Suite (VIIRS) • Studied 12-yr trends in surface temperature and melt extent, and compared with other data
Can compare MODIS IST directly with model-derived ice sheet surface skin temperatures Mean-Monthly Surface Temperature ( K) MODIS IST MERRA surface skin temperature Used MERRA301.prod.assim.tavgM_2d_rad_Nx -- surface skin temperature
Monthly-mean MODIS ice-surface temperature (IST) color-coded maps for 2010 Jan Feb Mar Apr IST cannot be acquired through cloud cover May Jun Jul Aug • Hall, D.K., J.C. Comiso, N.E. DiGirolamo, C.A. Shuman, J.R. Key and L.S. Koenig, 2012: A Satellite-Derived Climate-Quality Data Record of the Clear-Sky Surface Temperature of the Greenland Ice Sheet, Journal of Climate. Sep Oct Nov Dec http://modis-snow-ice.gsfc.nasa.gov
Coverage of Monthly-Mean IST Maps Coverage January 2010 IST Coverage April 2010 IST Number of Days Cloudcover is lowest in the spring (MAM) Average number of days (2000 – 2010) available to create the monthly-mean IST maps by month Hall et al., 2012, JCLIM
Comparison of MODIS IST and AWS near-surface air temperature Summit Station 2003 AWS data supplied by J. Box/OSU Air temperature is not the same as surface temperature, especially over ice
Comparison of MODIS IST and AWS near-surface air temperature NASA-SE Station – July 2003
12-Year Trends in Ice Surface Temperature and Melt Because the record is short, the trends are not statistically significant and can change with each new data point
Annual MODIS IST Anomalies Based on 11-yr Record 2001 2002 2003 2004 2005 2006 Warmer (positive anomalies) average Cooler (negative anomalies) 2009 2010 2011 2007 2008
Above 2000 m IST Anomalies IST Anomaly °C 2010 2010 Trend = +0.36°C / decade Below 2000 m Greater IST increase below ~2000 m, consistent with ATM, ICESat and GRACE measurements showing greater mass loss below ~2000 m Surface melt above ~1500 m is refrozen and retained (Humphrey et al., 2012), while melt below ~1500 m runs off, contributing to SLR IST Anomaly °C Trend = +0.48°C / decade
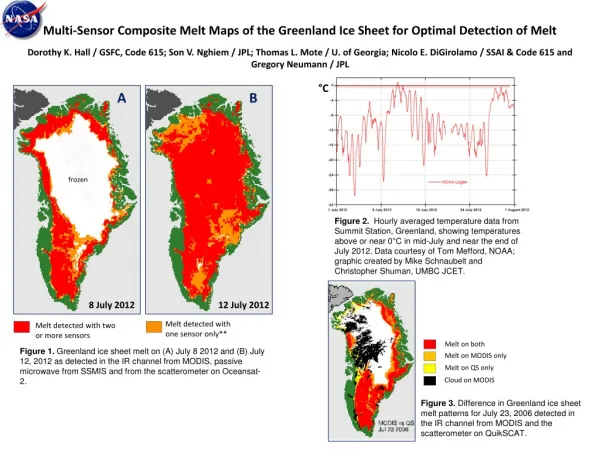
Maximum Melt Extent based on the MODIS IST ESDR, 2000 – 2011 Only 1 day of melt in the year 3 days of melt in the year 2 days of melt 4 or more days of melt
Maximum Melt Extent based on the MODIS IST ESDR, 2000 – 2011 Based on 4 or more days of melt (red on maps) Only 1 day of melt in the year *Based on melt = IST>-1°C 3 days of melt in the year 2 days of melt 4 or more days of melt
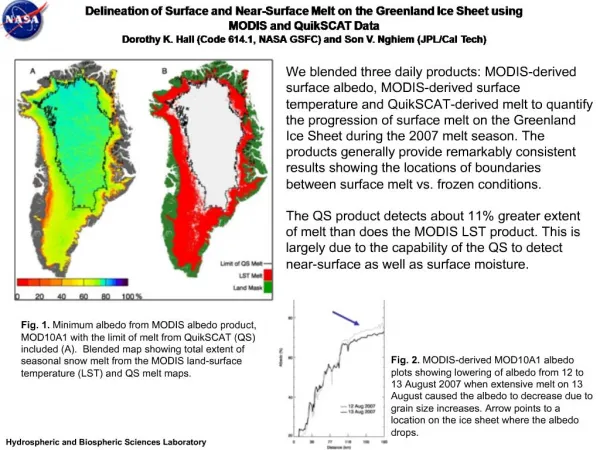
Satellite-Derived Melt Maps • Passive- and active-MW instruments detect surface and near-surface melt whereas IR instruments detect only surface melt; • Must resolve issues in measuring melt extent to provide ice sheet modelers with more accurate information.
Estimated potential maximum sea level rise from the total melting of present-day glaciers ~7.2 After Williams and Hall, 1993
Conclusions • Changes in Arctic sea ice, duration of ice cover on lakes, mountain glaciers, snow cover, permafrost and the Greenland Ice Sheet have been observed; • ATM, ICESat and GRACE measurements show mass loss of the Greenland Ice Sheet below ~2000 m in elevation; • A consistent pattern of ice sheet warming and increasing melt extent has been observed with different instruments, though the magnitude of changes differs; • IST can validate skin-temperature output of models, and as input to ice dynamics models, to improve accuracy of ice sheet mass balance and SLR estimates.