Download
1 / 33
330 likes | 353 Vues
Learn about the IFEX 2014 field campaign goals, flight experiments, and anticipated activities in improving hurricane intensity forecasting. Collaboration with NASA, DOE, and university teams enhancing observation strategies. Detailed presentation on IFEX goals and modules to advance hurricane research.

E N D
Intensity Forecasting Experiment (IFEX) 2014 Hurricane Field Campaign Paul Reasor – HFP Director Hurricane Research Division July 10, 2014
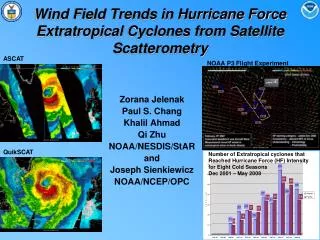
Intensity Forecasting Experiment (IFEX; Rogers et al., BAMS, 2013) IFEX Goal 1: Collect Observations for Model Initialization and Evaluation IFEX Goal 2: Develop and Refine Measurement Strategies & Technologies IFEX Goal 3: Improve Understanding of the Physical Processes Involved in Intensity Change
IFEX 2014 Flight Experiments/Modules P-3 TDR Coyote-UAS Ocean Winds G-IV TDR TC-Ocean Interact. Rapid Int HBL Entrain. TC Diurnal Conv. Turb. Micro Vortex Enviro. Intensity change is a multi-scale process • Sample TCs and the environment on multiple scales IFEX Atmospheric Scales Micro mm - cm Turbulent m - km Convective 100 m - 5 km Vortex 1 - 100 km Environment 100 - 10,000 km Goal 1 Model Eval. DWL HBL & SAL Goal 2 TC in Shear Goal 3 Arc Cloud Conv. Burst Landfall
2014 Anticipated Activities/Collaborations • EMC-tasked P-3 TDR missions • Test G-IV TDR patterns and real-time data transmission to NCEP • Optimizing Observations to Better Evaluate and Improve NOAA’s HWRF Operational Model/Sandy Supplemental • Atmospheric component (P-3s, G-IV, C-130, Global Hawks) • Oceanic component (profilers, floats, drifters, gliders) • Emerging Tech: Coyote, Doppler Wind Lidar, Sondes w/ SST sensor • Additional missions in support of IFEX Goals 1-3 • Coordinate with NASA’s HS3 Field Program • DOE Joint Interagency Project: Offshore wind farm • CCN (NASA) and gamma-/X-ray (UC Santa Cruz) measurements • Coordinate with 4 university teams deploying mobile towers, etc.
2014 HRD Field Program Plans • Be available for operationally-tasked missions • Crews available for twice daily P-3 and G-IV missions • Take-off times ~ 2 pm and 2 am, adjusted to ensure TDR data is available for each HWRF cycle • TDR processing initiated from the ground • Modules possible during TDR missions • Stagger P-3 and G-IV missions as done during Ingrid (2013) • Execute multi-aircraft missions out of St. Croix • AXBTs transported in advance • 2 P-3s and G-IV available • WSRA (IWRAP) on N42RF (N43RF) all season • AOC dual flatplate TDR antenna on both P-3s • Seek Mexican clearance for E. Pacific option
2014 HFP Presentations Model Evaluation/Sandy Supplemental: Overview 1a) Optimizing Observations to Better Evaluate and Improve NOAA's HWRF Operational Model -- Cione 1b) Ocean Response -- UhlhornIFEX experiments/modules: The Details IFEX Goal 1: 2a) P-3 Three-dimensional Doppler Winds Mission -- Gamache 2b) G-IV TDR Experiment -- Gamache IFEX Goal 2: 3) DWL SAL Module – Dunion 4) DWL BL Module -- J. Zhang 5) SUAVE -- Cione 6) SFMR High-incidence Angle Measurements Module -- Uhlhorn7) NESDIS Ocean Winds and Rain Experiment -- ChangIFEX Goal 3:8) TC Diurnal Cycle Experiment – Dunion9) SAL Experiment: Arc Cloud Module – Dunion10) HBL Entrainment Flux Module -- J. Zhang 11) Convective Burst Module -- Aksoy/Rogers 12) GoM Ocean Response Experiment -- Shay13) Rapid Intensification Experiment -- Kaplan14) Tropical Cyclone Landfall Experiment -- Kaplan15) TC in Shear Experiment -- Reasor 16) Offshore Wind Farm Module – Murillo
P-3 TDR 3D Winds Experiment PI(s):John Gamache, Vijay Tallapragada, Mingjing Tong, Peter Dodge, Paul Reasor, AltugAksoy, Kathryn Sellwood, SimAberson, Sonia Otero, John Hill Purpose: Provide a comprehensive wind data set for initialization (including data assimilation) and validation of hurricane numerical simulations such as HWRF, and to expand the database of 3D wind analyses used to improve basic understanding of TC structure and intensity change Plan: 2 P-3 Flights per day • On-station time centered on 6/12 and 18/0 UTC analysis periods (6 and 18 UTC take-off times) • Developing systems a priority • Landfall-threat and time-to-landfall conditions relaxed
P-3 TDR 3D Winds Experiment Sea-surface motion module 5 minutes
P-3 TDR 3D Winds Experiment Radar Dropsonde
G-IV TDR 3D Winds Experiment PI(s): John Gamache, Vijay Tallapragada, Mingjing Tong, Peter Dodge, Paul Reasor, Altug Aksoy, Kathryn Sellwood, Sim Aberson, Sonia Otero, John Hill Purpose: Provide a comprehensive wind data set for initialization (including data assimilation) and validation of hurricane numerical simulations such as HWRF, and to expand the database of 3D wind analyses used to improve basic understanding of TC structure and intensity change Plan: G-IV flights when not tasked by NHC for surveillance - Prefer octagonal flight pattern radially outside eyewall - Prefer mature hurricane environment
G-IV TDR 3D Winds Experiment Sea-surface motion module 5 minutes
G-IV TDR 3D Winds Experiment G-IV TDR in Ingrid (2013) Near-core circumnavigation (1, 1.5, 2) of Ingrid by the G-IV yields a TDR wind analysis in the region of maximum winds comparable to that from the P-3
Optimizing observations and observing strategies to better evaluate and improve model physical processes Overarching Objective… Improve forecast performance through a systematic evaluation process, whereby model biases are documented, understood, & ultimately eliminated by implementing accurate, observation-based physical parameterizations.
Model Evaluation & Improvement Methodology… Compare model with obsERVATIONS Emphasize wavenumber 0/1 analyses Make model improvements Conduct targeted OSE/OSSE studies TARGET DATA GAPS Conduct model simulations to understand model sensitivity
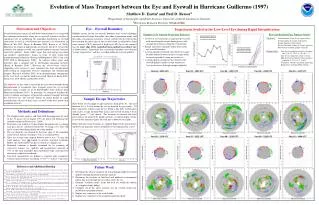
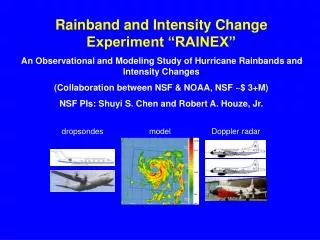
Manned & Unmanned Aircraft Observing Strategies for Model Physics Evaluation (2014-2015) Mission Description The ideal experiment consists of coordinated three-plane missions designed to observe several mechanisms responsible for modulating convective activity, hurricane structure and storm intensity change, involving: Air-sea energy exchange and boundary layer processes Convective processes (storm and surroundings) Dynamic/thermodynamic processes (storm and surroundings) Cloud microphysics Storm track (blue), and observation region (red box), optimally suited for multi-aircraft experiment. Range rings are 200 nmi relative to forward operating base at STX (TISX). Track marks are spaced every 24 hrs.
Plan: Establish a multi-aircraft experimental design in geographical areas with limited operational requirements over a 24h refresh cycle One NOAA P3 Captures the core, storm scale circulation (e.g. Current TDR mission profiles) 2nd NOAA P3 Responsible for sampling predetermined areas of interest outside the immediate TC high wind inner core (e.g. Entrainment flux module) NOAA GIV Primarily responsible for capturing the tropical cyclone’s surrounding larger scale environment
Targeted processes include air-sea exchange, vertical/horizontal transport resulting from convective activity, interactions with the surrounding environment, and ocean response. There are 3 high-priority research foci for this experiment: Air-Sea Exchange TC Inner Core Processes (R<~150 km) TC Environment Processes (R>~150 km) Several research experiments/modules that support the above foci include: TC-Ocean Response Experiment (Uhlhorn, Lumpkin, Centurioni, Shay) Hurricane Boundary Layer Entrainment Flux Module (J. Zhang, G. Barnes) Hurricane Boundary Layer Inflow Experiment (J. Zhang, E. Uhlhorn, J. Cione) SUAVE (Cione) RAPX (Kaplan, Rogers, Dunion) Microphysics - Aerosol/Cloud droplet measurement option (B. Black) SALEX-Arc Cloud Module (Dunion) Doppler Wind Lidar (DWL) Boundary-layer Module (J. Zhang) Doppler Wind Lidar (DWL) SAL Module (Dunion) TC Diurnal Cycle Experiment (Dunion) TC in Shear Experiment (Reasor) Convective Burst Module (Rogers)
Objective: To sample the wind, temperature, and moisture fields within and around an area of deep convection at high time frequency and to utilize them in high-resolution data assimilation experiments. Convective burst module • Altitude: 12,000 ft (4 km) altitude preferable. • Expendables: Release dropsondes at turn points and at intermediate points. Additionally, release 1-2 drops during penetration of convective system. No more than 15 dropsondes needed for this module. • Pattern: Circumnavigation (IP to point 6) by single P-3 when burst is outside RMW or in weak system. Then fly convective crossing (6-7-FP). Repeat circumnavigation (time permitting). If available, high-altitude aircraft (e.g., ER-2 or Global Hawk) flies either racetrack or bowtie pattern during P-3 circumnavigation, flies vertically aligned with P-3 during convective crossing. Repeated radial penetration (i.e. bowtie) when burst is inside or near RMW of tropical storm or hurricane.
Hurricane Boundary-layer Entrainment Flux Module Module (Option 1) - Stepped Descent Module (Option 1) cross section ~40 minutes This module can be included or linked with any of the following missions: UAS Experiment, shear experiment, NHC- EMC-HRD Three-dimensional Doppler Winds Experiment missions, Arc cloud experiment, or TC Landfall and Inland Decay Experiment. Module (Option 2) - Box ~20 minutes constant altitude at ~1.5 km
TC Ocean Response • Project goaland objectives: To observe and improve our understanding of the upper-ocean response to TC passages. • In addition, these ocean datasets fulfill needs for initializing ocean components of coupled TC Forecast systems at EMC and elsewhere.
Ideal Operational Concept • Target specific storm Cat-1 hurricane or greater • Storm is not an imminent threat to US • Limits interfering with operational priorities Storm track with locations plotted every 12 hours. Range rings are 200 nmi relative to forward operating base at St. Croix, USVI (STX/TISX), and red line delineates storm locations within 600 nmi of STX. In this example, the storm center remains within 600 nmi for 4 days.
Pre-storm • Target region is centered ~48 hours prior to forecast arrival of storm • P-3 flight track (red line) and ocean sampling pattern consisting of a grid of AXCTD/AXBT • Obtain synoptic temperature and salinity 3-D structure • Probes are deployed at ~0.5 deg. intervals. Total time for this pattern is estimated to be ~9 hours. • Floats (Nick Shay/RSMAS) and drifters (SIO/AOML) deployed by Air Force C-130 aircraft 24-48 hours prior to storm arrival • Measure time evolution of upper ocean temperature, salinity, currents, turbulence Floats/drifters Expendable Profilers
In-storm • Revisit area previously sampled at time when storm is directly over the area. • Measure forcing mechanisms (P-3 and C-130) • Surface winds (SFMR) • Near surface atmospheric thermodynamics (dropsondes with new SST sensors) • Directional wave spectra (WSRA – N42RF) • Floats/drifters continue to obtain data
Post-storm • Obtain temperature and current profiles 1 to 2 days after storm passage at same location • Ideally would extend at least one full inertial wavelength (L = 2pV/f ) – depends on range limitations • Floats/drifters continue to obtain data
Glider Operations • Two gliders begin profiling in July • W. Atlantic and E. Caribbean • Many T/S profiles
SFMR High-incidence Angle Measurements Module(s) Eric Uhlhorn and Heather Holbach Hurricane Gustav 20080831I1
Modules • Aircraft: N42RF (WSRA) • Dropsonde + AXBT at beginning of pattern • Coordinate with WindSat overpasses • Low wind (<5 m/s, 10 kts), high incidence angle response • This module is designed to determine the antenna pattern corrections and possible impacts of sun glint • Fly circles at roll angles of 15, 30, 45, and 60 degrees • Moderate wind response (~15 m/s, 30 kts) • This module is designed to understand the mixed “phase” (i.e., foam vs roughness contributions to brightness temperature) • Fly circles at roll angles of 15, 30, and 45 degrees • Moderate winds (~15 m/s, 30 kts) and substantial swell • This module is designed to determine the sensitivity to stress • This can be performed on the way to the storm or in different sectors of the storm • Fly circles at roll angles of 15, 30, and 45 degrees • Strong wind response (>30 m/s, 60 kts) • This module should be flown in multiple storm quadrants (motion relative) • Fly circles at roll angles of 15, 30, and 45 degrees
Offshore Wind Farm Module Objective: Determine the design conditions to engineer wind turbines to withstand hurricanes Schematic of piggyback pattern showing hypothetical wind farm fly-by with expendable launches at a 2 km interval for 20 km. No U.S. wind farms are yet in operation. (Dong Energy “Gunfleet Sands 1” farm off SE England)
Potential offshore wind farm and Atlantic Wind Connection subsurface transmission line locations in federal waters off the U. S. Atlantic coast. Additional areas include state waters off Maine, Nantucket Sound MA, Block Island RI, Atlantic City NJ, Virginia Beach VA, and near Port Isabel TX
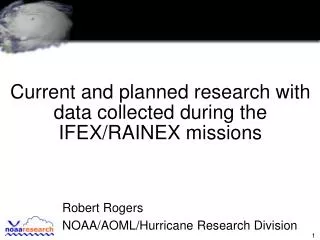
NASA’s Hurricane & Severe Storm Sentinel (HS3)A multi-year investigation of Atlantic hurricanes • Science objective: investigate environmental and storm-scale processes relevant to intensity change • 2014 time window: Aug. 26 - Sept. 29 • Operate out of Wallops Island, VA • 2 Global Hawks (storm environment and over-storm flight) • Collaborate with NASA on flight pattern to maximum data coverage and continuity Global Hawk
2014 HRD Field Program Logistics • Daily Schedule: • 9 am conf. call/meeting w. IFEX participants (if needed) • 10 am NOAA and NASA HS3 PIs telecon (Aug - Sept) • 12 pm weather discussion (28 July – 17 Oct) • Goto meeting info available • 1 pm AOC telecon (if needed) • Daily blog/email update (during field operations) • HFP Visitors: • Sim.Aberson@noaa.gov is coordinating HFP visitors this season. Please contact him if you wish to be put on the list.
Communicating in the Field • Our blog • http://noaahrd.wordpress.com • HRD Web page • http://www.aoml.noaa.gov/hrd • Facebook • http://www.facebook.com/noaahrd • Twitter • http://twitter.com/#!/HRD_AOML_NOAA Thank you!