Describing Scatterplots
850 likes | 869 Vues
Learn how to describe the shape, trend, and strength of scatterplots for both univariate and bivariate data. Understand the 6-step process to analyze scatterplots and identify any outliers or clusters.

Describing Scatterplots
E N D
Presentation Transcript
Describing Scatterplots Section 3.1
Data Univariate data:
Data Univariate data: data that involve a single variable per case This is the type of data we have been working with so far.
Data Bivariate data:
Data Bivariate data: data that involve two variables per case
Data Bivariate data: data that involve two variables per case For quantitative variables, often displayed as a scatterplot.
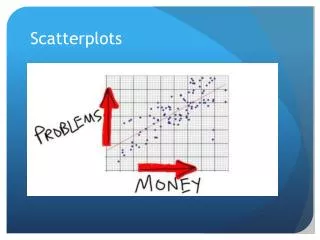
Scatterplot Scatterplot shows relationship between two quantitative variables.
Scatterplot Scatterplot shows relationship between two quantitative variables. y vs x
Describing Scatterplots Recall, for univariate data we use shape, center, and spread to summarize data.
Describing Scatterplots Recall, for univariate data we use shape, center, and spread to summarize data. For bivariate data, we use shape, trend, and strength.
Describing Scatterplots Describing scatterplots is a 6-step process.
6-Step Process • Identify cases and variables
6-Step Process • Identify cases and variables • Describe overall shape
6-Step Process • Identify cases and variables • Describe overall shape • Describe trend
6-Step Process • Identify cases and variables • Describe overall shape • Describe trend • Describe strength
6-Step Process • Identify cases and variables • Describe overall shape • Describe trend • Describe strength • Does pattern generalize to other cases?
6-Step Process • Identify cases and variables • Describe overall shape • Describe trend • Describe strength • Does pattern generalize to other cases? • Plausible explanation for pattern – or is there a lurking variable
1. Identify Cases and Variables Need these to put the data in context; otherwise, data are meaningless
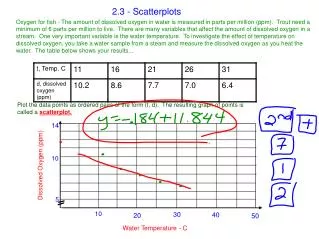
Cases and Variables Scatterplot: each point represents one case
Cases and Variables Scatterplot: each point represents one case x-coordinate equal to value of one variable and y-coordinate equal to value of the other variable Describe scale (units of measurement) and range of each variable
2. Describe Overall Shape • Linearity: is pattern linear, curved, or none at all?
2. Describe Overall Shape • Linearity: is pattern linear, curved, or none at all? • Clusters: is there just one cluster or more than one?
2. Describe Overall Shape • Linearity: is pattern linear, curved, or none at all? • Clusters: is there just one cluster or more than one? • Outliers: any striking exceptions to the pattern?
Shape : Linear Points do not have to form a line to have a linear pattern!
Clusters Is there just one cluster or is there more than one?
3. Describe Trend If as x gets larger, y tends to get larger, there is a positive trend.
Trend Think of slope!
Trend If as x gets larger, y tends to get smaller, there is a negative trend.
Trend If there is no shape, then there is no trend.
4. Describe Strength If the points cluster closely around an imaginary line or curve, the strength is strong.
4. Describe Strength If the points are scattered farther away from an imaginary line or curve, the strengthdecreases.