Download
1 / 23
230 likes | 331 Vues
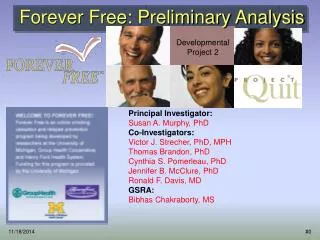
Forever Free: Preliminary Analysis. Developmental Project 2. Principal Investigator: Susan A. Murphy, PhD Co-Investigators: Victor J. Strecher, PhD, MPH Thomas Brandon, PhD Cynthia S. Pomerleau, PhD Jennifer B. McClure, PhD Ronald F. Davis, MD GSRA: Bibhas Chakraborty, MS.

E N D
Forever Free: Preliminary Analysis Developmental Project 2 Principal Investigator: Susan A. Murphy, PhD Co-Investigators: Victor J. Strecher, PhD, MPH Thomas Brandon, PhD Cynthia S. Pomerleau, PhD Jennifer B. McClure, PhD Ronald F. Davis, MD GSRA: Bibhas Chakraborty, MS
Goals of Forever Free Project • Provide a follow-on program to Project Quit participants: - to help those who have already quit smoking, stay quit - to assist those who haven’t quit in succeeding on their next attempt • Screen & identify factors influencing cessation among participants who completed a web- based smoking cessation program like Project Quit.
Study Parameters Target Audience: Adults who have participated in a web based smoking cessation program like Project Quit. Study Sites: Cancer Research Network HMOs • Henry Ford Health System - Detroit, MI • Group Health Cooperative - Seattle, WA
Screening Factors • Tailoring Locus (E): Expert Navigation (+) vs. User Navigation (-) • Graphical Presentation (G): Graphic Rich (+) vs. Graphic Poor (-) • Control Group
Factor 1: Tailoring Locus Expert Navigation User Navigation Meg, The Librarian
Factor 2: Graphical Presentation Rich Poor
Study Design G + - E: Tailoring Locus G: Graphic Presentation + E Control Group - n = total number of subjects
Outcome Measures • 7-day point prevalence in smoking cessation (1=smoker, 0=non-smoker) • proportion of time (% days) over three months an individual was smoking • A binary version of the above (1=smoker, 0=non-smoker) So we will be talking about smoking rate, rather than quit rate!
Comparison of past smoking behavior of those who consented to Forever Free vs. those who did not
Who consents, who doesn’t? • If you look at the smoking background of subjects, which group of subjects do you think was more likely to have smoked during Project Quit study? - Consenters to Forever Free - Non-consenters What do you think?
Here is what the data say… Project Quit 6 Month Data (n=596) The differences are not statistically significant!
Whose outcome is missing, whose not? • If you look at the smoking background of subjects, which group of subjects do you think was more likely to have smoked during Project Quit study? - Those whose Forever Free 3-month outcome is missing - Those whose Forever Free 3-month outcome is not missing What do you think?
Here is what the data say… Project Quit 6 Month Data (n=327) Only those who consented for Forever Free study 3 months ago or earlier are considered in this analysis The 2nd difference is statistically significant. Why?
Are the Forever Free Cells Balanced with respect to Past Smoking Behavior?
Mean % Days Smoking: Confidence Intervals We are considering Project Quit 6-month Data E = Tailoring Locus: Expert vs. User G = Graphical Presentation: Rich vs. Poor 1: Control 2: EG = ++ 3: EG = +- 4: EG = -+ 5: EG = --
Preliminary Analysis of Forever Free 3-month Outcome
Logistic Regression Results The outcome is essentially binary. A logistic regression of the 7-day point prevalence on the factors gives the following results:
Smoking Probability: 95% Confidence Intervals E = Tailoring Locus G = Graphic Presentation Control arm has the highest estimated probability of smoking, which is what we anticipated! 1: Control, 2: EG = ++, 3: EG = +-, 4: EG = -+, 5: EG = --.
Suggestions for further analyses? • What other analyses can be potentially informative? - Comparison of male vs. female? - Comparison of subjects from different HMOs? - Analysis using some Project Quit factors? • Please see the handout for a list of available variables…
Smoking Probability: 95% Confidence Intervals Logistic regression of 7-day point prevalence (Project Quit 6-month data) on the Forever Free factors… 1: Control 2: EG = ++ 3: EG = +- 4: EG = -+ 5: EG = --