1.5 Analyzing Graphs of a Function
1.5 Analyzing Graphs of a Function. Objective. Use the Vertical Line Test for functions. Find the zeros of functions. Determine intervals on which functions are increasing or decreasing and determine relative maximum and relative minimum values of functions.

1.5 Analyzing Graphs of a Function
E N D
Presentation Transcript
Objective • Use the Vertical Line Test for functions. • Find the zeros of functions. • Determine intervals on which functions are increasing or decreasing and determine relative maximum and relative minimum values of functions. • Determine the average rate of change of a function. • Identify even and odd functions
The Graph of a Function • The graph of a function f is the collection of ordered (x, f(x)) such that x is the domain of f. • x = the directed distance from the y-axis • y = f(x) = the directed distance from the x-axis
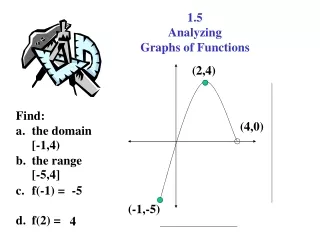
Example 1 Finding the Domain and Range of a Function • Use the graph of the function f to find (a) the domain of f, (b) the function values f(-1) and f(2) and (c) the range of f.
Vertical Line Test for Functions • A set of points in a coordinate plane is the graph of y as a function of x if and only if no vertical line intersects the graph at more than one point.
Example 2 Use the Vertical Line Test to decide whether the graphs represent y as a function of x. One y for every x.
One y for every x. This is a piecewise function. There are two pieces of functions.
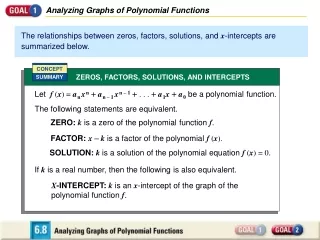
Zeros of a Function • The zeros of a function f of x are the x-values for which f(x) = 0.
Example 3 Finding the zeros of a Function Examples on next slide.
Increasing and Decreasing Functions • A function f is increasing on an interval if, for any x1 and x2in the interval, x1 < x2 implies f(x1) < f(x2). • A function f is decreasing on an interval if, for any x1 and x2in the interval, x1 < x2 implies f(x1) > f(x2). • A function f is constant on an interval if, for any x1 and x2in the interval, f(x1) = f(x2).
Relative Minimum • A function value f(a) is called a relative minimum of f if there exists an interval (x1,x2) that contains a such that
Relative Maximum • A function value f(a) is called a relative maximum of f if there exists an interval (x1,x2) that contains a such that
Finding Local Maxima and Local Minima from a Graph • At what numbers, if any, does f have a local maximum? x = -2.5 • What are the local maxima? (-2.5, 5) • At what numbers, if any, does f have a local minimum? X = 2.5 • What are the local minima? • (2.5,4)
Using the calculator to find local maxima and local minima • Find the local maxima and minima for 2nd Trace Select maximum, enter
Place cursor to left side of maximum enter Place cursor to right side of maximum enter Shows maximum at (-2.1, 4.06) Guess, Enter
To find the minimum, do the same thing but select minimum instead of maximum.
Average Rate of Change • For a nonlinear graph whose slope changes at each point, the average rate of change between any two points is the slope of the line through the two points. • The line through the two points is called the secant line.
Even and Odd Functions • A function is said to be even if its graph is symmetric with respect to the y-axis and a function is said to be odd if its graph is symmetric with respect to the origin.
Tests for Even and Odd Functions. • A function is even if, for each x in the domain of f, f(-x) = f(x). • A function is odd if, for each x in the domain of f, f(-x) = -f(x).
Example 9 Even and Odd Functions • Determine whether the following functions are even, odd, or neither. No y-axis or origin symmetry