Download
1 / 35
370 likes | 644 Vues
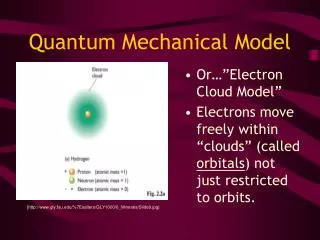
Ordered and Quantum Treemaps: Making Effective Use of 2D Space to Display Hierarchies. By Bederson, B.B., Shneiderman, B., and Wattenberg, M. ACM Transactions on Graphics (TOG) , October 2002. Layla Shahamat Kenny Weiss March 8, 2005. Outline. Motivation Main Ideas Related Work Demo

E N D
Ordered and Quantum Treemaps: Making Effective Use of 2D Space to Display Hierarchies. By Bederson, B.B., Shneiderman, B., and Wattenberg, M. ACM Transactions on Graphics (TOG) , October 2002. Layla Shahamat Kenny Weiss March 8, 2005
Outline • Motivation • Main Ideas • Related Work • Demo • Treemap 4.0 • Quantum Treemaps • Demo • Photomesa • Concluding Remarks
Motivation What information do you get from this tree? How about more realistic bigger trees?
Motivation • Displaying large hierarchical information structures • First Spark!Solving 1990’s common problem of displaying filled hard disk in order to achieve goals such as • Displaying the file system in a compact way • Better utilization of available pixels • Visually appealing • Informative, easy to browse, easy to read
Treemap Development • Treemap - Novel idea and design of the algorithm was developed by
What is a treemap? • Space-filling visualization method to represent large hierarchical structures of quantitative data. • The Key idea is creating the nested rectangles that make up the layout.
Treemap Algorithm Overview • Each node in the tree hierarchy has a name, and an associated size. • Treemap is constructed via recursive subdivision of the initial rectangle • The direction of the subdivision alternates per level between horizontally and vertically. • The area of each rectangle in the treemap is proportional to the size of that particular node. • Aspect ratio of a rectangle is the maximum of width/height and height/width.
Different types of Treemaps Quantum
Slice and Dice Algorithm • Creates rectangles with high aspect ratio • As a result hard to see skinny rectangles 6 6 Areas 6, 6, 4, 3, 2, 2, 1 6 6 4 3 2 2 6 4 4 horizontal 16/1 Vertical 36/1
Cluster (Map of Market) http://www.smartmoney.com/marketmap
Cluster Treemap &Squarified Treemap • Drawbacks • Rapid Dramatic changes in the layout resulting from change in data • Second by second updates • Flickering • Ignoring the order of the data (e.g. alphabetical) • Switching between vertical and horizontal squares • Harder to locate data or see patterns
Ordered Treemap • Algorithm change smoothly under dynamic updates. • Produces rectangles with low aspect ratio. Higher readability • Solves the problem of ordered data such as alphabetical indexed data
Ordered Treemap Algorithm Rp R3 (> Rp) (> R2) R1 (< Rp) R2 (> Rp) (< R3) Rp = {Size, Middle, Split-Size}
Ordered Treemap AlgorithmPivot by size Algorithm • Inspired byQuickSort • If the number of items <= 4, lay them out in R, stop. • Let P, the pivot, be the item with the largest size. • Divide R into 4 rectangles, R1,Rp,R2,R3 • Divide the items in the list, except p items, into 3 lists L1,L2,L3 • All L1 indexes are less than p. • All the items in L2 have smaller indexes than the ones in L3 (L2.index < L3.index) • Repeat until items <= 4.
Different types of Ordered Treemaps • All these algorithm preserve the ordering of the index of the items. • Pivot-by-size O(n*n) • Pivot-by-middle O(nlogn) worst case • Pivot-by-split-size
Strip Treemap Overview • Modification of Squarified Treemap Alg. • Preserves Order. • Eliminating the final skinny strip by developing look ahead strip • Better readability than the ordered treemap Algorithm. • Average Run time O(sqrt(n))
Strip Treemap Algorithm • Creates an empty strip called current strip. • Adds a rectangle to the current strip • If average aspect ratio increases, remove the rectangle from the strip • Create a new strip & add the rectangle • If average aspect ratio decreases or stays the same, add the rectangle to the current strip.
How Do We Compare? • Evaluation Metric • Average aspect Ratio of a treemap layout • Average aspect ratio is arithmetic average of all aspect ratios of all leaf-node rectangles. The lowest is 1.Different calculation is possible. • Layout Distance Change • Distance function measuring how much rectangles move as data gets updated • Readability: how easy it is to locate an item • Measuring eye motion direction changes
Monte Carlo Trials ExperimentDesign • The data constantly gets updated. • For each experiment ran 100 trials of 100 steps each. • 3 different collections of data
Monte Carlo Trials Experiment Results • Slice and Dice Method shows the tradeoff between aspect ratio and smooth updates. • Ordered and Strip treemaps fall in the middle. • Cluster and squarified treemaps show low aspect ratio, large changes.
Static Stock Market Experiment • Data: 535 publicly traded companies • High aspect ratios are due to the outliers in the data
User Study of Layout Readability • 100 rectangles with random size & uniform distribution. • Measured the time it took the user to find a numerical ID. • Each subject performed 10 tasks for each 3 alg. • 20 subjects, 20% female,80% male, 50% student • Squarified treemap • longest time to locate an item • lowest user preference
User Study of Layout Readability results • Subject preference was in the same direction as the readability metric • Strip users found the item 60% faster than when using squarified treemap.
Quantum TreemapsProblem • Input size of elements is fixed • Similar Images • Pictures • Pages • Grouping • Integral multiples of fixed input • Search • Meaningful categories • Ordered layout
Quantum TreemapsProcedure • Similar to other treemaps • Input: • List of image groups • Number elements in each group • Fixed aspect ratio • Output • List of rectangles • Constraints • Guaranteed to fit images • Can have extra space • Must fit contents into rows and columns
Scale to fit Long skinny rectangle Visually unattractive Slow to scan Align content Global Grid Groups are integral multiples of quanta Fit images into rectangles
Quantized Strip Treemap • Difference from normal striptree (ST) • Rectangle Area = Integral multiples of quanta • Ragged Edges • Distribute extra space throughout width • Same complexity as ST • Up to a constant • Can use other treemap strategies • Subtle changes may be necessary
Element Aspect Ratio • Aspect ratio (AR) doesn’t affect layout algorithm • Can stretch out starting box by inverse of aspect ratio • Visually has same effect
Ragged Edges • QST • distribute space along width to fix ragged edge • General case • distribute globally • Left and Bottom edges may be ragged
Horizontal and Vertical Growth • Grow to match rectangle to quantum ratio • Experiments show best results when • Grow width in wide layouts • Grow height in vertical layouts x Wide layout Change height x x Change width
Comparison QT has better average aspect ratio, but wastes more space than ordinary treemap
Analysis • QT works better when groups have more elements • More flexibility • Wastes less space (proportionally) • 1000 elements (30x34), (31x33), (32x32) • Each element is ~0.1% • 5 elements (1x5), (2x3) • Each element is ~20% • Single global grid • Quantum size • Usually, if domain requires constant size,other considerations are outweighed
Thoughts • Informative background information on various Treemap strategies • Experiments discuss dynamic ordered data • Order preservation helps users orient themselves • Categorical data not discussed • Photomesa • Impressive overview of a lot of information • very nice {overview, zoom, filter, details} • GUI works well while loading images • Zoom is abrupt and pixelated • Compare to Picasa and Photoshop Album • TreeMap • Would be nice if “File Mapper” offered file previews