Download
1 / 51
510 likes | 540 Vues
This comprehensive report by John Husing, Ph.D., delves into the rapid population growth, job forecasts, housing affordability issues, and demographic trends in the Inland Empire. It addresses key challenges such as workforce qualifications, poverty rates, and educational needs in the region to sustain economic development. The analysis also discusses the impact of industries like healthcare, logistics, manufacturing, and construction on the local economy. Furthermore, it highlights the effects of government regulations, tariffs, and environmental concerns on various sectors in the Inland Empire. Stay informed about the factors shaping the region's progress and the obstacles that lie ahead.

E N D
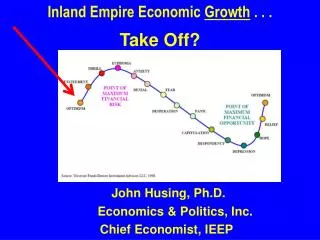
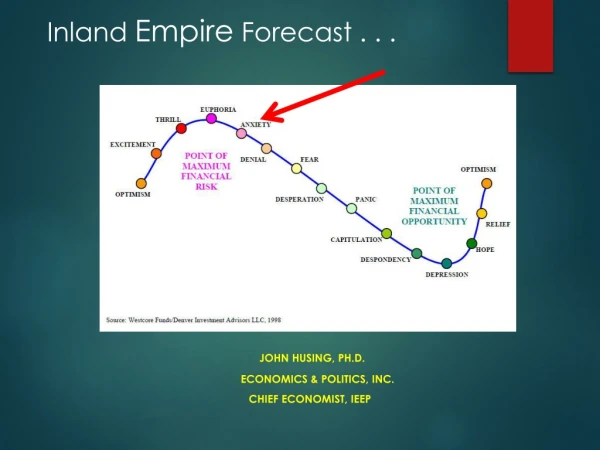
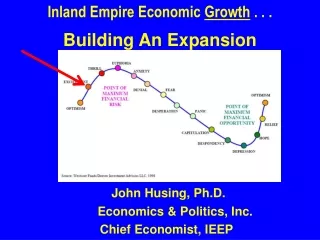
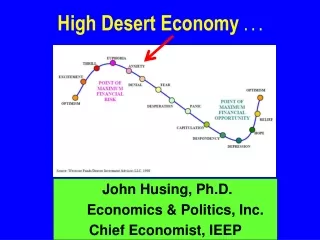
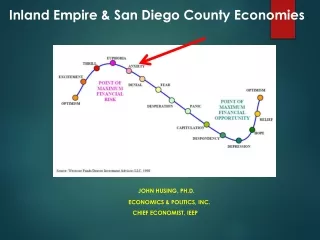
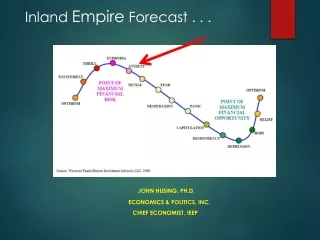
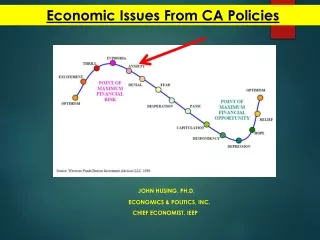
The Inland Empire Why The Explosive Growth? Issues We Face! John Husing, Ph.D. Chief Economist, IEEP
Inland Empire Population Greater Than 25 of 50 States
Population Forecast, 2018-2045 2045: 6,119,497 1,111,783
Job Forecast, 2015-2040 2040: 2,100,712 710,402
Price Competition Highest Price Gaps In History
Housing Market Consequences • Lack of New Housing Construction In High-End Counties • NIMBY Opposition to Affordable Workforce Housing • Downzoning by City Councils • CEQA Allows Easy Lawsuits to Stop Projects • State Solution: Force Population Into Attached Urban Units • Marginally Educated Force To Move … Inland Counties Deal With the Results: • School Challenges • Workforce Qualifications • Poverty
Share in Poverty, 2017 23.5% 16.4%
Gold Mine Theory Secondary Tier Primary Tier 21%
Sector Job Growth 2011-2018 2011-2018 10.7% of Job Growth 2011-2018 12.8% Of Job Growth 2011-2018 23.8% of Job Growth 2011-2018 4.5% of Job Growth 2011-2018 3.4% of Job Growth
Median Health Care Pay: 2018 $62,363
ACA & Health Care Demand -60% Drop in Uninsured
2019 Forecast: 4,800 Rationale: Health Providers Paid 65% of Medicaid Costs Shortage of Trained Workers ACA Attacks
Median Logistics Pay: 2018 $47,946
Skill Ladders Based on Education for PositionMedian Pay Warehousing, Inland Empire 2017
E-Commerce 14.5%
Net Industrial Absorption 21.9 Milllion
New Industrial Construction 3.5% Vacancy
2019 Forecast: 9,000 Rationale: Running Out of Land in the Valley Areas Tariffs Shortage of Trained Middle Managers U.S. Growth Slowdown
AQMD: Indirect Source Rule Attempt To Make Warehousing Operations Pay For Trucks Coming To Them To Slow Sector’s Growth Slowing Growth Would Close Opportunities For Marginally Educated Workers Robert Woods Johnson Public Health Research on What Causes Public Health Problems: • Socio-Economics Issues (poverty, lack of jobs) 40% • Population Health Behaviors Related to Poverty 30% • Access to Medical Care due to Poverty 20% • Environmental Issues 10% 90% Source: Different Perspectives For Assigning Weights To Determinants of Health, University of Wisconsin, Public Health Institute, 2010
ONT Airport Cargo Another Record Volume 14.8% 1.0%
2018 Median Manufacturing Pay $54,800 Lack of Growth Closes Opportunities For Marginally Educated Workers
CA Electrical Cost +83.5% +135.4%
2019 Forecast: 1,000 Rationale: Regulation & CA Electrical Costs Automation Tariffs Shortage of Replacement Skilled Workers U.S. Growth Slowdown
Median Construction Pay: 2018 $53,322 Slower Growth Hurts Opportunities For Marginally Educated Workers
Home Prices +4.6% -10.1%
2019 Forecast: 6,000 Rationale: Difficulty Permitting Lots CA Environmental Quality Act Very High Prices, Low Volume, Lack of Supply Shortage of Skilled Craft Workers
ONT Airport Passengers 12.4% 1989 Level 4.2% 1988-2018 Population: up 2.4 million or 108.2% to 4.6 million Job Level: up 864,502 or 133.5% to 1,512,194 Companies: up 75,133 or 187.3% to 75,133
2019 Forecast: 3,500 Rationale: Education Gap To Coastal Counties Government Tax Revenue Difficulty (internet) Professionals Serve IE From Coastal Offices
Median Moderate Paying & Real Estate, Finance, Education Jobs: 2018 $57,109
2019 Forecast: 3,900 Rationale: Banks Hiring Less Real Estate Sales Not Growing School Budget Growth May Slow
Population Serving Sectors E-commerce death High End Consumers Still Doing Well 3rd Strongest Inland Sector
2019 Forecast: 9,900 Rationale: E-Commerce Hurts Retailing Lack of Available Workers (4.2% Unemployment) Workers Going to Logistics
2019 Forecast 2018 = 49,300 Growth 3.36% Unemployment 4.2% 2019 = 38,200 v. 2018 = 49,300 Growth 2.52% 3.36% Unemployment 4.2% 4.2%