Download
1 / 18
180 likes | 265 Vues
Learn how statistical analysis by the IPCC helps identify causes of climate change, including anthropogenic greenhouse gas emissions. Requirements and methods for detection and attribution are discussed, with a focus on separating signals accurately from background noise.

E N D
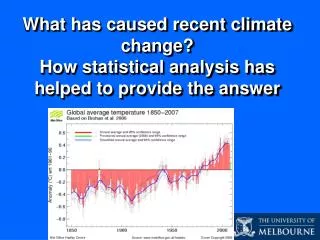
What has caused recent climate change? How statistical analysis has helped to provide the answer
Intergovernmental Panel on Climate Change (IPCC) • Joint body of UN Environment Program and World Meteorological Organization, established in 1988 • Every 5-6 years, carries out a comprehensive assessment of climate change science, impacts, and approaches for mitigation and adaptation to climate change • Includes representatives from all countries • Fourth Assessment Report prepared by more than 500 scientists over the last three years • Summaries for Policy Makers approved by consensus (including representatives of the Australian govt) at meetings in Paris (Feb 07), Brussels (Apr 07) and Bangkok (May 07) • Received the 2007 Nobel Peace Prize jointly with Al Gore • Available from www.ipcc.ch
Causes of recent climate changeRadiative forcing components IPCC WGI Fig SPM.2 WGI Fig SPM.2
What is the most likely cause? ‘Most of the observed increase in global average temperatures since the mid-20th century is very likely (more than 90% certain) due to the observed increase in anthropogenic greenhouse gas concentrations.’ IPCC(2007) IPCC WGI Fig TS.23
What is detection and attribution? Detection of significant observed climate change and attribution of this observed change to one or more causes is a signal-in-noise problem: identifying possible signals in the noise of natural internal climate variations in the chaotic climate system. Detectionis the process of demonstrating that an observed change is significantly different (in a statistical sense) than can be explained by natural internal climate variability.
What is detection and attribution? Attribution of climate change to specific causes involves statistical analysis and the careful assessment of multiple lines of evidence to demonstrate that the observed changes are: • unlikely to be due entirely to internal climate variability; • consistent with the estimated responses to a given combination of anthropogenic and natural forcing; and • not consistent with alternative, physically plausible explanations of recent climate change
Requirements of detection and attribution? • Variable with high signal-to-noise ratio • Long observational record • Long control model simulations and ensembles of forced climate model simulations • Consistent response to specified forcings between different models – consistent signals • Separable signals between different forcings • Statistical analysis methods that enhance signal relative to noise and for identifying signals in observed changes
Detection and attribution methods • Greater confidence when • We are able to separate the contributions to observed change from individual sources • Decompose the observed global surface temperature change into contributions from GHG forcing, aerosol forcing, natural forcing, internal variability • Account for multiple known sources of uncertainty • Models and observations agree on the amplitude of the contributions • Able to demonstrate that competing explanations are not viable • Models simulate similar levels of internal variability as observed
Observations Model 1946-56 1986-96 Filtering and projection onto reduced dimension space Total least squares regression in reduced dimension space Evaluate amplitude estimates Evaluate goodness of fit Weaver and Zwiers, 2000
Signals estimated from • Multi-model ensembles of 20th century simulations • With different combinations of external forcings • Anthropogenic (GHG, aerosols, etc) • Natural (Volcanic, solar) • Multiple models, ensemble sizes from 1-9 runs • Assume linearity of response • Observations represented in a dimension-reduced space • Typically filtered • Spatially (to retain large scales) • Temporally (to retain decadal variability - 5-10 decades) • Projected onto low-order space-time EOFs IPCC WG1 AR4 Fig. TS-23
Solar Volcanic GHGs Ozone All Direct SO4 aerosol Examples of signals 20th century response to forcing simulated by PCM IPCC WG1 AR4 Fig. 9.1
Scaling factor • Alters amplitude of simulated response pattern • Error term • Sampling error in observations (likely small) • Internal variability (substantial, particular at smaller scales) • Misfit between model-simulated signal and real signal (hopefully small … a scaling factor near unity would support this) • Signal error term represents effects of • Internal variability (ensemble sizes are finite) • Structural error • Know that multi-model mean often a better presentation of current climate • Do not know how model space has been sampled • Ultimate small sample inference problem: Observations provide very little information about the error variance-covariance structure
We think models adequately represent internal surface temperature variability on global scales … Variability of observed and simulated annual global mean surface temperature (1901-2005) ALL forcings 58 simulations 14 models IPCC WG1 AR4 Fig. 9.7
… and also on continental scales IPCC WG1 AR4 Fig. 9.8
Observations Model 1946-56 1986-96 Filtering and projection onto reduced dimension space Total least squares regression in reduced dimension space Evaluate amplitude estimates Evaluate goodness of fit Weaver and Zwiers, 2000
‘Most of the observed increase in global average temperatures since the mid-20th century is very likely due to the observed increase in anthropogenic greenhouse gas concentrations.’ Estimated contribution from greenhouse gas (red), other anthropogenic (green) and natural (blue) components to observed global mean surface temperature changes, based on ‘optimal’ detection analyses 1900-99 1950-99
Summary • There have been significant advances in the methods used for attribution of the causes of observed climate change over the past two decades • A clear anthropogenic signal can be identified in observed climate changes over the last 50 years in many variables and in temperature in almost all regions • Most of the observed increase in global average temperatures since the mid-20th century is very likely due to the observed increase in anthropogenic greenhouse gas concentrations. IPCC AR4 WGI chapt 9 (www.ipcc.ch)