
Topographic Maps
Topographic Maps. v 0016 of 'Topographic Maps' by Greg Pouch at 2011-02-06 12:34:33 LastSavedBeforeThis 2011-02-06 11:08:03 Home_Geo101TopoMaps.ppt. Topographic Maps. 3 Maps 4 Scale Frames of Reference (horizontal)

Topographic Maps
E N D
Presentation Transcript
Topographic Maps v 0016 of 'Topographic Maps' by Greg Pouch at 2011-02-06 12:34:33 LastSavedBeforeThis 2011-02-06 11:08:03 Home_Geo101\TopoMaps.ppt
Topographic Maps 3 Maps 4 Scale Frames of Reference (horizontal) 5 Frames of reference > How do you indicate where something is? Descriptions 6 Frames of reference > How do you indicate where something is? Coordinates 7 Frames of reference > How do you indicate where something is? Property Lines 8 Where is it 2? (Vertical) How high? Elevations 9 Contour Lines Example Topo Map of Salt Lake City 11 Cross Sections 12 Cross Sections->Vertical Exaggeration 13 Cross Sections->VE PseudoExamples 14 Cross Sections->VE PseudoExamples
Maps • A map is a two-dimensional representation of some part of the earth where distance on the map represents horizontal distance on the earth. Because the earth is round (sphere or ellipsoid or lumpy ellipsoid-like blob, depending on how exact you want to be) and a map is flat, there are going to be problems. • A flat map can not show distances correctly between each arbitrary pair of points (it would have to be spherical if it did), but it can show distance from one point to any other point correctly. • A map can't show correctly both area and 'shape', so the mapmaker has to make some compromises in selecting a map projection. • Further, a map can't show everything, so a map usually only shows some things well and ignores others. (The map is not the territory.) • Geologists and other natural scientists prefer maps that are conformal: they show 'shape' correctly for small areas, and at any point and for small distance, the ratio of map distance to world distance is the same regardless of directions. [When cartographers talk about shape, they mean that a right angle in the world is a right angle on the map, and a 60° angle in the world is a 60° angle on the map], and that the scale is the same in all directions for small distances at each point on the map, although the scale then has to vary across the map. • The maps most often used by geologists are called topographic maps or topo maps or topos. A topo map shows the land surface (topography) by means of contour lines and spot elevations. Additionally, topo maps show water features, roads and other cultural features like buildings and power lines, and some property boundaries. • A map that just shows roads, buildings and property lines is called a plat. • You can find maps that show wetlands, that show soil types, that show geology…. • Many maps, instead of having a blank background, use rectified airphotos as a background for easy location.
Scale • Scale is the map's ratio of map distance to world distance • Scale=MapDistance/WorldDistance • WorldDistance=MapDistance/Scale • MapDistance=WorldDistance*Scale • On a 1:24,000 map one inch on the map represents [not equals] 24,000 inches (2,000 feet) on the ground. 1:24,000 English and 1:25,000 metric maps are common large scale maps in the US. [A smaller scale map shows a given thing as smaller.] • One mile is 5280ft, or 5280ft*12 inches/ft=63,360 inches, so a 1:62,500 map (another common series) is nearly 1 inch to the mile. There are also some 1:63,360 maps in the US. • In metric countries, 1:10K, 1:25K, 1:50K, 1:100K are common. Easy to convert map-cm to world-km. • The stated fractional scale, like 1:24,000, and verbal scale (1 inch to 2000 ft) applies to the printed original of the map. Paper shrinks and swells with the humidity (5% just putting a hand next to it, this is why paper often wrinkles when you're working on it), so there is also a graphical scale (scale bar) that shows how big on the map various distances are. This shrinks and swells with the paper and any photocopying, so the scale bar is the most accurate way to represent the scale. The fractional and verbal scales are always useful, since they indicate how much detail will be shown: an enlarged map doesn't show more detail or greater accuracy, it's just occupying more space. Consider that in this presentation, the scale bar is still accurate, but the fractional scale and verbal scale are not known until I position the projector. But an enlarged 1:250,000 map shows only very large features, no matter how much I enlarge it.
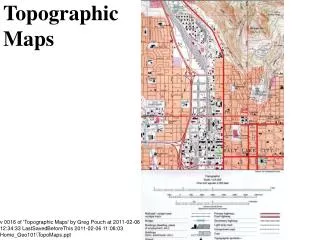
Frames of referenceHow do you indicate where something is? Descriptions Consider the problem of telling someone where the screen is. You could say it is on the front wall , in the middle (relative, verbal location). But I would need to know where the edges of the room are, and if I'm on the floor above, this does me no good. You could also specify it by saying it's 17 feet in front of the projector (relative, numerical location) Both rely on a landmark (which must still be there, and known to speaker and listener). No good for maps or communication across time. Another way would be to mark a location on the floor to indicate a starting point, and another to define (in conjunction with the first) a direction (e.g., for north). Then we can specify locations relative to our first point (benchmark), either in terms like 4m North, 3m East (cartesian coordinates) or 7.2m along S41W (polar coordinates). If we have some locations {A} specified relative to benchmark+baseline pair A, and others {B} specified to benchmark+baseline B, we can tie the two together by finding A's coordinates in space B, and B's coordinates in space A. (Don't worry about the details: think of this sort of like currency conversions.) This is basically one way to make a map: we measure offsets from some given location, and plot these on paper to make a map.
Frames of referenceHow do you indicate where something is? Coordinates • From a landmark Both of these assume familiarity with the locations • Directions from a point From the house, go 4 miles along a line connecting the house with the radio tower, and 9.2 miles in the direction to the right of that line. • Distance and bearing from a point Polar coordinates from a point 3.22 miles, N67W You have a starting point, and you relate everything back to it. The problem is merging these. • Grid • Treat earth as flat sheet, use XYZ coordinates. (i.e., you start at a point of known coordinates, and measure offsets from there, adding to your starting point, so you get new coordinates) Grids work very well for small areas like buildings and counties, but the curvature of the Earth starts to break it down around areas larger than 25 miles across. • In addition to benchmark+baseline, grids can be based on mathematical functions, like UTM(x,y,z)=f(longitude,latitude,elevation) • UTM Universal Transverse Mercator was invented by Army Map Office to allow specification of a point by coordinates, so you could radio this to other people and have them meet you there, or leave supplies, or hit it with artillery fire or … It's common on maps and most GPS units can display location in UTM. It allows calculations of distance and bearing in a grid system, and is much easier to work with than longitude-latitude. • Spherical/Ellipsoidal This is polar coordinates on a sphere or ellipsoid. A point is specified by latitude (angle above or below the equator, -90 to +90), longitude (angle counterclockwise from a north-south meridian going through the Royal Observatory in Greenwich -180 to +180). Degrees are usually subdivided into minutes, and minutes into seconds. Or they can be expressed as decimal degrees. Empirically, people have a hard time calculating positions in DegMinSec and make lots of mistakes, hence UTM. Unless you're surveying England, determining initial locations can be trouble, hence there are datums.
Frames of referenceHow do you indicate where something is? Property Lines Where something is relative to equator and the transit at the Royal Observatory is all well and good, but it's also important to indicate where property lines are, to indicate Who owns it? • Metes and Bounds In the eastern US and many other locations, property lines were specified by a starting point, and a bearing and distance to the next point. It's very easy for properties to overlap, and finding the landmarks is a huge pain (streams shift, rocks get moved, trees die, no one now knows "where Jake shot the bear"….) • USPLSS (US Public Land Survey System) The Continental Congress had lots of surveyors (Washington, Jefferson….) and they hated metes and bounds. The only useful accomplishment of the Continental Congress (other than eliminating the Crown) was the Northwest Land Ordinance Act, which subdivided the "uninhabited" areas of the Northwest Territories (and later, other areas) onto a grid-like system. USPLSS had three requirements, that can't be met on sphere. • Boundaries run north-south or east-west • Sections are each one mile on a side • All sections enclose the same area. For each big area (a Principal Meridian's area), the survey party would pick a spot for the origin, then survey a north-south line (known as a meridian) and an east-west line (known as a baseline) and place monuments. Then they go off into the wilderness and survey auxiliary baselines every 36 miles (this varied), then run auxiliary meridians at right angles every 36 miles (note that the auxiliary meridians from one auxiliary baseline won't line up with auxiliary meridians from another, due to Earth's curvature) and place monuments. Then they survey in tiers and ranges within the blocks, and finally half-sections within the townships (intersection of a tier and range) Because these are property lines, once accepted, they stay fixed. Most farmland in the US is described like SE1/4 of SW ¼ of S. 17, R3E, T8N 3rd PM [Get IWU's location here]
Where is it 2? How high? Elevations In addition to horizontal locations, places have vertical elevation (how high, usually expressed as elevation above mean sea level [huge can of worms] This can be shown with shaded relief, which is easy to understand but hard to quantify, or elevation contours ("lines" of equal elevation) and spot elevations which are easy to quantify but harder to visualize. From http://egsc.usgs.gov/isb/pubs/teachers-packets/mapshow/posterandpacket.html
Contour Lines • An [elevation] contour is a "line" (actually, it's an irregular path) all of whose points are at the same elevation. (There are lines of equal pressure shown on weather maps, and all sorts of other things can get contoured.) A contour represents one elevation. • Intersection of the land surface with a horizontal plane. A shoreline is a contour line. • Points between two contours have elevations between their elevations (e.g., everything between a 50ft contour and a 60ft contour should be in the 50s), although this is sometimes violated for clarity. • Contours don't intersect, although they might bunch up at a cliff. (If there is an upper and lower land surface at an overhang, the elevation is that of the upper surface.) • Contours never split or divide (kind of. This could happen, but it's very rare.) • Contours don't just end. They either close on the map or somewhere off the map. • On topo maps: • On a topo map, there are a series of contours, and they are equally spaced vertically. The vertical distance between contours is the contour interval CI. Conventionally, every fifth contour is bolded and labelled. Sometimes, extra contours, called supplemental contours (dashed or dotted), are added to show important but small topography. Except for supplemental contours, the contour interval is constant on a topo map. • Spacing of contours: Closely spaced contours indicate steep slopes, widely spaced contours indicate gentle slopes. • Streams cross contours at right angles. [Streams flow downhill, and contours are cross-hill, so they have to be perpendicular] • Contours V uphill at streams. • Closed contours indicate a hill or a closed depression if hachured (fairly rare). • To find the elevation of an unlabelled contour, find a labelled contour or spot elevation and figure out which way up is, and count up or down. • Gradient The slope of a land surface is (change in elevation)/(change in distance) = (difference between contours)/(distance between contours)and is usually expressed in feet/mile, but can be given a gradient or slope (degrees) From http://www.geomart.com/products/topo/readingtopos.htm
Cross Sections A map is a representation of horizontal locations [ (X,Y), (Easting,Northing), (Latitude,Longitude) ] of things. A map is kind of what things look like from above (a vertical perspective) A map is really a vertical isometric view. Top View The elevations (contours and spot elevations) on a topo map show the vertical location of things [elevation, height, distance away from earth], but don't influence location on the map. A cross section is kind of what things look like from across (a horizontal perspective). Side view. When you're standing on the ground looking at the horizon, your perspective is kind of like a cross-section. A cross section is really any horizontal isometric view. More exactly, a cross section shows elevation plotted vertically and horizontal position (X, Y, or some combination of X and Y, even curvilinear, like elevations along a stream or road, chosen to show interesting features) plotted horizontally. To make a cross-section from a map, Get a sheet of graph paper. Pick the line and mark it on the map, but not the maps in lab. Tape another sheet of paper on the map, and record on the paper the locations of contours (and values), any spot elevation, and streams or sinkholes which will be local minima, or hilltops, which will be local maxima, and other interesting features like political boundaries or buildings. While you're doing this, keep track of highest and lowest elevations encountered. Select a vertical scale for an exaggerated section. Tape the second sheet to the graph paper, and transfer elevations etc and plot them, both on the exaggerated scale and a 1:1 section (Same scale vertically and horizontally. (The 1:1 section will usually be a slightly wiggly horizontal line.)
Cross Sections->Vertical Exaggeration If you plot horizontal and vertical distance using the same scale factor, you get an isometric view, and angles are preserved. In almost all cases, you see remarkably little elevation change, and you can't see the hills or valleys, especially in flat areas where people usually live, so we often show the vertical scale stretched or exaggerated compared to the horizontal scale. The ratio of vertical scale to horizontal scale is called the Vertical Exaggeration VE and should be shown on the cross section like VE=10X For 1 inch to 200ft vertical and 1 inch to 2000ft horizontal, which might be useful in Illinois (VE= horizontal_scale/vertical_scale= 1:2,400/1:24,000=24,000/2,400=10, so VE=10X) VE lets you show small elevation changes and gentle slopes on cross-section, but it makes them look steeper than they really are. (Plotted_Slope=atan(VE*tan(Real_Slope)) With VE of 10X, a 10° slope plots as 60° VE makes slopes look MUCH steeper than they really are: places like BryceCanyon or Zhangjiajie are rare. VE also happens on airphotos, because the perspective points are far apart compared to your eyes. Topography is not as steep as it looks on airphotos. Plate tectonics diagrams often have mixed VE (1X scale for mantle, enlarged topography on top.), which makes matters very confusing.
Cross Sections->VE PseudoExamples This page shows a few photos with vertical exaggeration, to give some idea of its effects. This page shows an image on IL-9 near the Mackinaw River, (just north of Bloomington). VE=1X VE=5X VE=10X VE=20X VE=100X
Cross Sections->VE PseudoExamples This page shows a few photos with vertical exaggeration, to give some idea of its effects. VE=1X VE=5X VE=10X VE=20X VE=100X Image is near Ellsworth KS on KS-156


