Download
1 / 1
10 likes | 187 Vues
(a) RGB. (b) Phase. (d) Cloud Base Height. (c) Top Height. (e) Effective Radius. (f) LWP. 16 UTC PIREPS. (g) Icing Threat. GOES–R Applications for the Assessment of Aviation Hazards Wayne Feltz, John Mecikalski, Mike Pavolonis, Kenneth Pryor, and Bill Smith. P1.82. 1. INTRODUCTION.

E N D
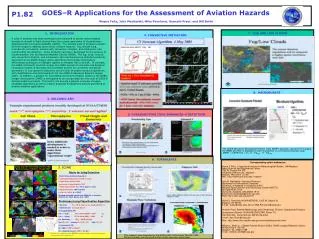
(a) RGB (b) Phase (d) Cloud Base Height (c) Top Height (e) Effective Radius (f) LWP 16 UTC PIREPS (g) Icing Threat GOES–R Applications for the Assessment of Aviation Hazards Wayne Feltz, John Mecikalski, Mike Pavolonis, Kenneth Pryor, and Bill Smith P1.82 1. INTRODUCTION 7. FOG AND LOW CLOUDS 4. CONVECTIVE INITIATION A suite of products has been developed and evaluated to assess meteorological hazards to aircraft in flight derived from the current generation of Geostationary Operational Environmental Satellite (GOES). The existing suite of products includes derived images to address seven major aviation hazards: fog, aircraft icing, microbursts, turbulence, volcanic ash, convective initiation, and enhanced-v and overshooting top detection. Some products have been developed for the purpose of implementation into the National Weather Service AWIPS. The fog, icing, volcanic ash, convective initiation, and enhanced-v and overshooting top detection products, derived from the GOES imager, utilize algorithms that employ temperature differencing techniques to highlight regions of elevated risk to aircraft. In contrast, the GOES microburst products employ the GOES sounder to calculate risk based on conceptual models of favorable environmental profiles for convective downburst generation. It is proposed to adapt the current suite of aviation product algorithms, with modifications and enhancements, for the GOES-R Advanced Baseline Imager (ABI). In addition, a product for nowcasting convective initiation based on the GOES imager developed at CIMSS is anticipated to be incorporated into the suite of GOES-R derived aviation products. This poster will provide a general overview of legacy candidate algorithms as well as outline proposed development activity pertaining to aviation weather applications. 1800 UTC 7 June 2004 2000 UTC 30 March 2005 2000 UTC 30 March 2005 8. MICROBURSTS 2. VOLCANIC ASH * 5. OVERSHOOTING TOPS/ENHANCED-V DETECTION The GOES Microburst Windspeed Potential Index (MWPI) algorithm, derived from merging the WMSI and HMI, is designed to infer the presence of a convective boundary layer: MWPI = (CAPE/100) + G + (T - Td)850 - (T - Td)670 6. TURBULENCE Corresponding author addresses: Cloud properties and icing severity index North America, 1545 UTC, 17 April 2007 3. ICING Wayne F. Feltz, Cooperative Institute for Meteorological Studies UW-Madison Space Science and Engineering Center 1225 W. Dayton Rm 235 University of Wisconsin - Madison Madison, Wisconsin 53706 Web: http://www.ssec.wisc.edu/~waynef/ Tropopause folds Basis for Icing Detection Aircraft icing conditions depend on • supercooled liquid water (SLW) in cloud • liquid water content, LWC • presence of large droplets, SLD • VISST detects SLW: Tc < 272 K, phase = water • liquid water path: LWP = f(LWC) • effective radius, re = f(SLD) Develop threshold criteria from PIREPS & in situ data (Smith et al., 2003, Minnis et al., 2004): Preliminary Icing Classification Algorithm • No icing: Tc > 272 K, clear, or ice cloud with OD > 6 • Indeterminate:ice cloud, OD > 6 • Icing probability (IP) For re = 5 µm,IP = 0.147 ln(LWP) – 0.084 (1) For re = 16 µm,IP = 0.138 ln(LWP) – 0.024 (2) For observed re , IP(re) = f[IP(5), IP(16)] low, IP < 0.4; medium,0.4 <IP < 0.7; high,IP> 0.7 • Icing severity (IS) IS = light, if LWP < 432 gm-2 IS = moderate-heavy, if LWP > 432 gm-2 John R. Mecikalski, Assistant Professor Department of Atmospheric Sciences University of Alabama in Huntsville (UAH) National Space Science and Technology Center (NSSTC) 320 Sparkman Drive Huntsville, Alabama USA 35805-1912 Email: john.mecikalski@nsstc.uah.edu Web: http://nsstc.uah.edu/johnm • Water vapor gradients indicate the presence of CAT-inducing tropopause folds Michel J. Pavolonis (NOAA/NESDIS), 1225 W. Dayton St. Madison, WI 53706 E-mail: mpav@ssec.wisc.edu or Mike.Pavolonis@noaa.gov Kenneth Pryor, Satellite Meteorology and Climatology Division, Operational Products Development Branch, NOAA/NESDIS/STAR, Room 711 5200 Auth Rd., Camp Springs, MD 20746-4304 E-mail: Ken.Pryor@noaa.gov Web: http://www.orbit.nesdis.noaa.gov/smcd/opdb/kpryor/bio.html William L. Smith Jr., Climate Science Branch (E302), NASA Langley Research Center, MS 420 B1250 Rm 165 Hampton, VA. 23681-2199 E-mail: william.l.smith@nasa.gov For this case, moderate icing PIREPS confirm satellite-derived icing threat (also see Poster by Smith et al.) This research was supported by the NASA LaRC Subcontract #4400071484. More information can be found at http://cimss.ssec.wisc.edu/snaap/.