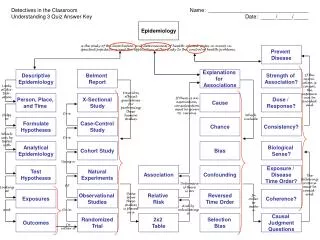
Case-Control study Selection of Cases
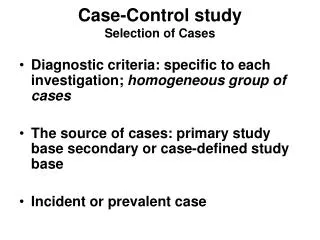
Case-Control study Selection of Cases. Diagnostic criteria: specific to each investigation; homogeneous group of cases The source of cases: primary study base secondary or case-defined study base Incident or prevalent case. Case-Control study Principles, control selection.

Case-Control study Selection of Cases
E N D
Presentation Transcript
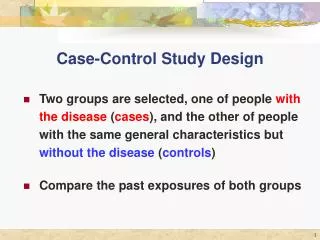
Case-Control studySelection of Cases • Diagnostic criteria: specific to each investigation; homogeneous group of cases • The source of cases: primary study base secondary or case-defined study base • Incident or prevalent case
Case-Control studyPrinciples, control selection • Should be selected from the samepopulation that gave rise to the cases • Controls should be selected independently of their exposure status; If sampling rate, the same for exposed and unexposed, is known, incidence rate can be calculated
Case-Control studySelection of Controls • Sources 1: a population explicitly defined • Methods: 1. No sampling: total population 2. Random and systematic sampling 3. Paired sampling
CasCase-Control study • When a list of all potential controls is not available • Random digit dialing (RDD) Sampling of households based on random selection of telephone numbers; matched to cases on area code and prefix 2. Paired Sampling Primary or *Secondary study base Alternative to RDD or RDD not realistic Implicit, indirect matching
Case-Control studyPaired sampling Objective • to provide a sampling scheme for control selection that minimizes subjectivity and arbitrariness during the process Individuals are selected by virtue of some defined temporal or geographic relationship to the case Example: • Next patient admitted after the case, the person living in the nearest residence to that of case, the student next to the case in an alphabetical class listing
Case-Control studyMatching; pre-specified distribution • Explicitly identified matching variables and values • Paired sampling: the next person admitted who satisfied the defined criteria • To select controls identical to the cases with respect to one or more potentially confounding factors, with certain homogeneous levels
Confounding • Rates: Counterfactual Substitution/Reference group • If both rates are not equal, before-after rate difference is confounded for the causal rate difference or ratio
Confoundingdefinition • A distortion of an exposure-outcome association brought about by the association of another factor with both outcome and exposure. • The definition of confounding involves a definition of the study hypothesis • Two associations, One condition
Criteria for a confounding facCriteria for a confounding factor • A confounding factor must be a risk factor for the disease: must be predictive of disease occurrence apart from its association from exposure • i.e. predictive among unexposed or reference group
Criteria for a confounding facCriteria for a confounding factor 2. A confounding factor must be associated with the exposure under study in the source population (the population at risk from which the cases derived) 3. A confounding factor must not be affected by the exposure or the disease Cannot be an intermediate step in the causal pathway Should be an extraneous risk factor
Standardization1 *Standard The set of weight that is used to taking weight average **Standardized Adjustment has been made for the effects of one or more potential confounding factors by calculating a weighted average of category- specific rates
Standardization • Direct a standard population with a known age distribution is selected comparable, a directly standardized rate can be compared with any other rate standardized to the same population • Indirect a set of age-specific standard rates is selected
StandardizaStandardizationStandardized Mortality Ratio; SMR • Indirect, Rates from: 1. non-exposed group from within the same occupational setting 2. A general population, e.g., TW male aged 20-59 years • Standardized mortality ratio = O/E
SMR • O: the number of cases observed in the study group • E = T1I1*+T2I2* +------ • It is generally not equal to the number of cases one should expect in the study group if it had experienced the rates of the reference population; Alteration of the person-time rate usually alters the distribution of person-time in the study group *Assumption:
SMR • Excess risk among those exposed • Using general population as standard, the magnitude is less than what has been estimated by relative risk; underestimate the increased or decreased risk • Should not be directly compared to evaluate the relative effect of different levels of exposure • The only valid comparison of an indirectly standardized rate is with the population from which the standardized rates derived
Causal relationship • Study design, selection of study subjects: external validity to be reasonable • Do the results support a causal relationship? • Observation bias confounding chance causal relationship Fall 2006 NCKU
Observation bias • Relevant to the measurement of the dependent variable in the study • In a cohort study: outcome • In a case-control study: exposure • The key issue is the relationship between the true value of the factor being assessed and the value of the variable chosen to represent the factor in the study
Non-differential error/bias • All methods of measurement will have a degree of error which is a function of the measurement used • However, the inaccuracy is similar in the different groups of subjects being compared
The effect of non-differential error • Make the observed association, e.g., the relative risk estimate, closer to the null value that is the true situation • The exposure variable measured, a very inaccurate estimate of the true biological factor concerned, because it is an extremely indirect measurement • The closer we come to the biological causal factor, the higher the relative risk will become • e.g., smoking: Yes/No, package-yr, DNA adduct
Bias, differential • Inaccuracy which is different in size or direction in one of the groups under study than in others • The effect: bias can influence the results of a study in any direction • The most important sources of bias are variation in the subject’s response to the method of assessment, and variation in the observer’s response
Bias in case-control study1Selection • Selection bias can occur whenever the inclusion of cases or controls into the study depends in some way on the exposure of interest, since exposure and disease have both occurred • e.g., Milk drinking and Salmonella infection