Download
1 / 20
200 likes | 350 Vues
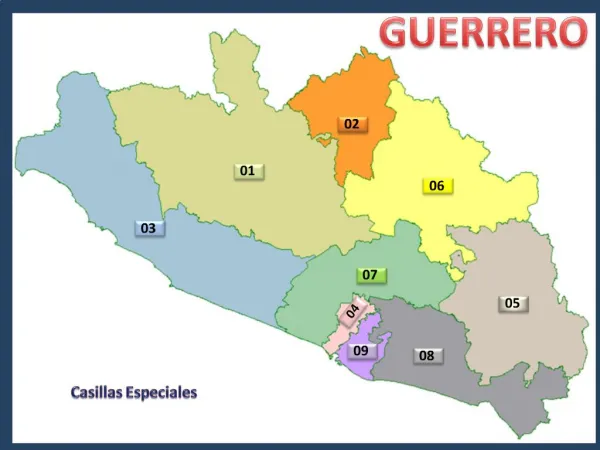
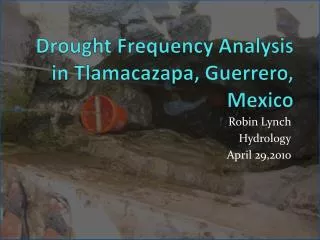
Drought Frequency Analysis in Tlamacazapa , Guerrero, Mexico. Robin Lynch Hydrology April 29,2010. Tlamacazapa , Guerrero. Remote mountain village Extreme poverty Water scarcity Reliant on wells contaminated with arsenic. Source: Google Maps. Previous Work. Concluded:

E N D
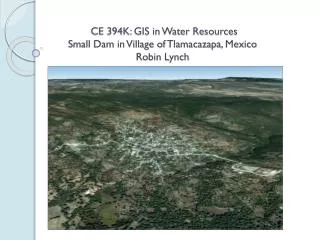
Drought Frequency Analysis in Tlamacazapa, Guerrero, Mexico Robin Lynch Hydrology April 29,2010
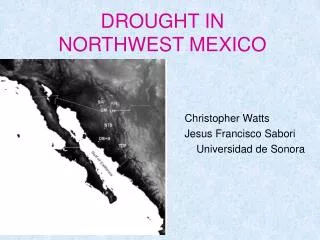
Tlamacazapa, Guerrero • Remote mountain village • Extreme poverty • Water scarcity • Reliant on wells contaminated with arsenic Source: Google Maps
Previous Work • Concluded: • Year round piped water possible…but • Needs 10 meter high dam downstream Source: Google Earth
Assumptions: • Only used average rainfall between 2003-2007 • Doesn’t take into account long term variability!
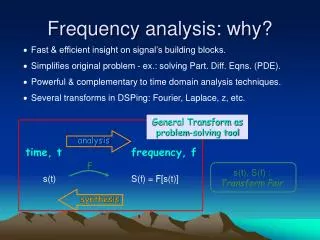
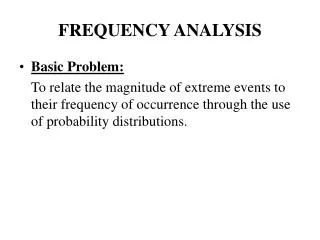
Drought Frequency Analysis • Determine how impacted Tlamcazapa is by droughts • Use SPI (Standardized Precipitation Index) • Assumes data is normally distributed Source: (Hallack-Algeria 2005)
InstitutoMexicano de Technologia del Agua (IMTA) • 16 gaging stations • Within 25 kilometer radius of Tlama • Rainfall data between 1940-1998 • Inconsistent years in each station
First station Source: (McKee et al. 1993)
Second Station Whoa!!!
Theissen Polygons • Cannot take average of SPI per year • Each gage’s SPI thrown off due to incomplete time span • Must use Theissen Polygons to choose Nearest Neighbor • For years when closest gage has no data, use nearest neighbor “hot decking” imputation procedure
60+ years of Data! • Data from 1940-2007 (1944,1946,1999-2002 missing)
HEC-SSP • Only looks at probability of exceedence
Drought Magnitude Source: (McKee et al. 1993)
Recurrence Probability P(SPI<0) = 0.5 P(SPI<-1)= 0.15 P(SPI<-1.5)= 0.1
Future Work • Statistical regression to see the relationship between drought and arsenic levels • Make recommendations for reservoir planning using this drought frequency analysis