Download
1 / 39
390 likes | 543 Vues
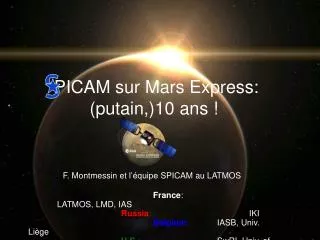
PICAM sur Mars Express: ( putain ,)10 ans !. F. Montmessin et l’équipe SPICAM au LATMOS France : LATMOS, LMD, IAS Russia : IKI Belgium : IASB, Univ. Liège U.S .: SwRI , Univ. of Arizona. L’équipe SPICAM.

E N D
PICAM sur Mars Express: (putain,)10 ans ! F. Montmessin et l’équipe SPICAM au LATMOS France: LATMOS, LMD, IASRussia: IKIBelgium: IASB, Univ. LiègeU.S.: SwRI, Univ. of Arizona
L’équipe SPICAM • France (LATMOS, LMD, IAS): F. Montmessin (PI), J.-L. Bertaux (ex-PI), A. Reberac, G. Lacombe, N. Chapron, F. Lefèvre, J.-Y. Chaufray, F. Leblanc, F. Forget, S. Lebonnois, E. Quémerais, L. Maltagliati, A. Määttänen, C. Listowski, B. Gondet • Russie (IKI) : O. Korablev (CoPI), A. Fedorova, A. Trokhimovsky, A.V. Rodin • Belgique(IASB, Univ. de Liège) : A.-C. Vandaele, N. Mateshvili, Y. Willamme, J.-C. Gérard, A. Stiepen, D. Fussen, C. Simon • U.S. (LPL): B. Sandel, A. Stern • Collaborations: P. Withers, S. Bougher, T. McDunn, N. Schneider, etc.
SPICAM « light » on Mars Express:4.8 kg SPICAM on Mars 96: 40 kg SPICAM UV/Vis étoile (17 kg) IR AOTF Spectrometer (0.8 kg) UV Grating Imaging Spectrometer (4 kg) SPICAM IR solar (23 kg)
SchémaOptique UV IR Bertaux et al. (JGR,2006)
Instrument développé au LATMOS (ex-Service d’aéronomie). • Le même instrument vole sur la mission ESA Venus Express. • Bandespectrale / Résolution:UV: 118-320 nm R=150 IR: 1.0-1.7 µm R=1300 • Modes d’observation: • Occultation (étoile / soleil) • Nadir • Limbe IR Spectrometer -800 g- UV Spectrometer -3 kg-
Transducer OUT Light IN RF IN TeO2crystal
NADIR : l’instrument vise dans la direction du centre de la planète = mesure du spectre de la lumière solaireréfléchie par la surface et l’atmosphère • Colonne d’abondance des constituants CO2, O3, H2O responsables des absorptions observées Mars Express spacecraft orbit Atmosphere MARS
LIMBE : L’instrument vise le “bord”dela planète = mesure du spectre des émissionset diffusion du spectresolaire par l’atmosphère Profil vertical en altitude des émissions aéronomiques et des poussières Mars Express spacecraft orbit Atmosphere MARS
Spectrum of the star : outside the atmosphere through the atmosphere OCCULTATION : L’instrument vise uneétoileà travers l’atmosphère de la planète = mesure du spectre de l’étoileà travers et hors atmosphère profilsverticaux des constituants responsables des absorptions observées (CO2, O3, O2, CO, H2O, aérosols) Line of sight Mars Express spacecraft star orbit Atmosphere MARS
Spectre UV (côténuit) NO δC2 – X2 NO γA2 + – X2 H Lyα Bertaux et al. (Science, 2005)
O21Dg Korablev et al. (JGR, 2006) The oxygen O21Dg emission line at 1.27 mm is produced by UV dissociation of O3 CO2 ice H2O ice
Etat des lieux • Instrument health: • UV channel defects noticed since orbit #2639 = additional “cleaning” stage in the pipeline • Further degradation since Safe Mode #25 of Mars Express in summer 2011 • IR channel has operated flawlessly and continues to do so • Data Production: • MEx has completed its 10,000th orbit in 2011 • SPICAM has achieved >10,000 observations and collected 13,500,000 UV spectra and 2,000,000 IR spectra to date • 63 Giga-Octets of data transmitted to Earth • Science Production: • 60 publications • JGR special edition (SPICAM results) in 2006 • >180 communications in workshops/conferences
Thèmesscientifiquescouverts • Emissions spontanées de l’atmosphère: • NO detection and characterization (UV) • Auroras and Dayglows (CO2+, CO, etc.) (UV) • Hydrogen and Oxygen corona (UV) • O2dayglow/nightglow (IR) (also relevant to 2.) • Composition et climat: • Ozone, carbon dioxide (temperature) and water vapor mapping and vertical profiling (UV& IR) • Aerosols and clouds characterization (UV & IR) • Surface(s) : • Phobos and Deimos observations (UV)
QuelquesaccomplissementsSPICAMesques….. • Martian Airglows: • First detection of Nitric Oxide emissions, revealing atmospheric global circulation pattern; • First detection of auroras above crustal magnetic field anomalies; • Characterization of dayglow and nightglow emissions; • Characterization of the O and H Martian corona. • Atmospheric Composition & Climate • Detection of mesospheric (>100 km) cloud layers, of likely CO2 ice origin; • First annual mapping of O3, simultaneously with H2O; • 4D (x,y,z,t) distribution of O3 and H2O through combination of occultation and nadir modes; • Compilation of the largest density/temperature dataset in the mesospheric/thermospheric 70 to 140 km altitude range; • Detection of water vapor in a high supersaturation state.
Spectrum of the star : outside the atmosphere through the atmosphere Atmospheric Transmission SPICAM Ultra-Violet observations, orbit #17 13 jan. 2004 ratio Line of sight Mars Express spacecraft star orbit Atmosphere MARS
Occultation sequence 1 spectrum / second z~1-3 km Prominent signatures of CO2, O3 and aerosols CO2 profile gives T(z) Aerosols affect wholespectral range and exhibits a pronounced spectral slope
Large differences between SPICAM observations and LMD GCM predictions for the mesopause altitude and temperature • O underestimated by model = CO2 cooling underestimated Forget et al. (JGR, 2009)
Nuagesmésosphériquesmartiens Montmessin et al.(Icarus, 2006)
Nuagesmésosphériquesmartiens : de la glace de CO2 ? Simultaneous temperature profile inversion indicates that layers appear partly inside supersaturated pockets of CO2
Evolution spatio-temporelle de l’activiténuages/aérosols : • Occultationsstellaires/solairesconfondues • Suivi de la hauteur max (plafond) des aérosolscorrespondantàuneopacitécolonne le long de la ligne de visée de 1 Ztop Määttänen et al., Icarus, 2013
NADIR : l’instrument vise dans la direction du centre de la planète = mesure du spectre de la lumière solaire réfléchie par la surface de la planète après qu’elle est traversée l’atmosphère • comparaison spectre mesuré/spectre solaire : Colonne d’abondance des constituants CO2, O3, H2O responsables des absorptions observées Mars Express spacecraft orbit Atmosphere MARS
SPICAM relative albedo 1.4 model with Earth O3/200 model with Earth O3 1.2 1.0 0.8 Relative albedo 0.6 0.4 0.2 0.0 200 220 240 260 280 300 320 wavelength (nm) CO2 Water vapour band Observation nadir : principe UV MEX/ SPICAM SPICAM – Ultra-Violet observations, orbit 8, 9 jan. 2004 IR Absorption by gas tv vertical opticalthickness of absorption, varies stronglywithwavelength θ1 SPICAM – nearInfraredobservations, orbit 8, 9 jan. 2004 Scattering by surface with albedo A
Multi-annual monitoring of H2O water vapor H2O, pr.mm MY27 MY27 MY28 MY28 MY29 MY30 Ls
Annual water vapor cycle: an average view H2O pr.mm All years combined 1 km3 of ice
Interannualvariability of H2O vapor H2O, pr.mm MY27 MY28 MY29 MY30
Atmospheric Transmission SPICAM Infrared observations Line of sight Mars Express spacecraft sun orbit Atmosphere
SPICAM data LMD GCM predictions north south northern spring-summer Maltagliati et al. (Science, 2011)
SPICAM data LMD GCM predictions north south southern spring Maltagliati et al. (Icarus, 2013)
Meeting SPICAM/SPICAV Poros Island (Greece): 28 june to 2 july 2010
Climate Model results:Water vapor contours (colors) superimposed on circulation pattern Northern summer Southern summer 60 km Aphelion cloud belt formation at z ~15 km 0.1 50 200 ppm Montmessin et al., 2004
On an annual average, the climatic asymmetry favors accumulation/storage of water in the north. Northern summer Southern summer 60 km Aphelion cloud belt formation at z ~15 km 0.1 50 200 ppm Montmessin et al., 2004
Northern summer Southern summer 60 km SPICAM GCM 0.1 50 200 ppm Montmessin et al., 2004
Interannualvariability of H2O vapor H2O, pr.mm MY27 MY28 MY29 MY30
Interannualvariability of H2O vapor H2O, pr.mm MY27 MY28 MY29 MY30