QM B Linear Programming
QM B Linear Programming. Overview. What is linear programming (LP)? Formulating LPs The Stratton company Graphical insight Using Excel Solver to solve LPs Mile-High Microbrewery. What is linear programming?. It is NOT computer programming. Programming here means planning.

QM B Linear Programming
E N D
Presentation Transcript
Overview • What is linear programming (LP)? • Formulating LPs • The Stratton company • Graphical insight • Using Excel Solver to solve LPs • Mile-High Microbrewery
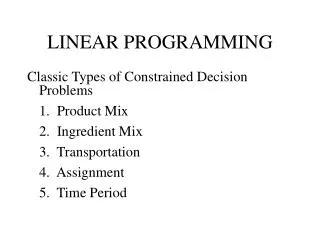
What is linear programming? • It is NOT computer programming. Programming here means planning. • Mathematical technique • Optimization technique • A decision needs to made • Our goal is to determine the ‘best’ or ‘optimum’ decision • There are scarce resources available and/or specified requirements for achieving our goal.
Proctor and GambleNorth American Product Sourcing • 50 products • 60 plants • 10 distribution centers • 1000 customer zones • Save $200 million dollars annually • Which products should be produced in which plants? • Which plants should supply which distribution centers? • Which distribution centers should supply which customer zones.
What does an LP look like? • There is a goal: objective function • Maximized or minimized • Written as a linear equation • There are scarce resources, restrictions and/or requirements: constraints • Limits your ability to achieve the goal • Written as a linear equation
Formulating an LP: Stratton Co. • Produces two basic types of plastic pipes • Three resources have been identified as critical to pipe output • Pipe extrusion hours • Packaging hours • Special additive mix
Stratton Company Data All data given is for a package of pipe – 100 feet
Stratton Company (cont) Formulate an LP model to determine how much of each type of pipe should be produced to maximize profit.
Three questions to formulate an LP: • What is the decision to be made? • Stratton Company • How much of pipe 1 to produce • How much of pipe 2 to produce • Defines the variables (if you are specific enough). • P1 – number of packages of Pipe 1 to produce • P2 – number of packages of Pipe 2 to produce
Question 2 for Formulating an LP: • What is the goal? • Stratton Company • Maximize profit • Defines the objective function MAX 34 P1 + 40 P2
What are the limited resources or requirements? Extrusion hours Packaging hours Additive mix 4P1 + 6P2 48 2P1 + 2P2 18 2P1 + 1P2 16 Question 3 for Formulating an LP:
Objective Function LP for Stratton Company MAX 34 P1 + 40 P2 Subject to: 4 P1 + 6 P2 48 Extrusion hours 2 P1 + 2 P2 18 Packaging hours 2 P1 + 1 P2 16 Additive supply P1 0 and P2 0 Non-negativity Constraints
Solving LPs • ‘What if’ analysis (go to Excel) • Graphical analysis • For insight • Simplex method • Solver – an Excel add-in • Computer packages designed for linear optimization
Graphical analysis – Extrusion constraint 4 P1 + 6 P2 48
Graphical analysis – Packaging Constraint 2 P1 + 2 P2 18
Graphical analysis – Additive supply constraint Feasible Region 2 P1 + 1 P2 16
Feasible Region • Set of all solutions that satisfy all of the constraints • Infinite number of solutions Which is the optimal solution? • One of the solutions at the corner points
Corner point solutions Feasible Region MAX 34 P1 + 40 P2 (go to Excel)
Stratton Company – Summary • Optimal solution • P1 = 3 • P2 = 6 • Max = $342 • The optimal product mix is 3 packages of Pipe 1 and 6 packages of Pipe 2. This provides a maximum profit of $342.
Setting up Excel Solver to solve LPs • Solver is an add-in to Excel • Not automatically ready • To get solver ready: In Excel Tools -> Add ins Scroll down to Solver Add in Check the box Click on OK • Only need to do this one time
Mile-High Microbrewery Mile-High Microbrewery makes a light beer and a dark beer. Mile-High has a limited supply of barley, limited bottling capacity, and a limited market for light beer. Profits are $0.20 per bottle of light beer and $0.50 per bottle of dark beer. Formulate an LP to maximize profits and determine how many bottles of each product should be produced per month.
Think-pair-share: Three questions: • What are the decisions to be made? • What is the goal? • What are the limited resources or requirements?
What are the decisions to be made? • L – Number of bottles of light beer to produce • D – Number of bottles of dark beer to produce
What is the goal? • Maximize profit MAX 0.20 L + 0.50 D
What are the limited resources or requirements? • Barley supply 0.10 L + 0.60 D 2000 • Bottling capacity 1 L + 1 D 6000 • Market capacity 1 L 4000
An aside for SUMPRODUCT function • 2 groups of cells • Both in a row or both in a columns • Wish to multiply the corresponding entries then sum the products =sumproduct(a2:c2, a3:c3) = 2*5 + 3*6 + 4*7
Think-pair-share: SUMPRODUCT function =SUMPRODUCT(B6:C6,B10:C10) = 2*2 + 1*4 = 8
To solve an LP using Excel Solver • Setup the spreadsheet • TYPE data in one place (go to Excel) • CREATE Cells for decisions variables • ENTER formulas to calculate LHS of constraints • ENTER formulas to calculate Objective Function • Open solver box Tools -> Solver
Excel Solver Dialog Box Click on cell that calculates objective function Select Max or Min Click & drag to select decision variables Click add to add the constraints
Excel solver – constraints dialog box Select cell(s) with LHS Select cell(s) with RHS Select symbol (, , =) Remember – Non-negativity constraints
Go to the Options Dialog box Click options to assume linear model
Last dialog box - options Click OK Check the Assume linear models box Check the Assume Non-negative box
Now SOLVE Click solve to find optimal solution
Solver found a solution Click on Answer and Sensitivity Click OK