Understanding Exponential Functions: A Comparative Analysis of Growth Models
This lesson explores the contrasting characteristics of linear and exponential growth using spreadsheet tools. We analyze two job options: one with a linear salary increase and another with an exponential increase. By examining their respective growth models, we determine when each option is favorable. The lesson also covers compounded interest, population growth, and the decay of medications in the body, illustrating real-life applications of exponential functions. Graphical representations will enhance understanding of these concepts.


Understanding Exponential Functions: A Comparative Analysis of Growth Models
E N D
Presentation Transcript
Intro to Exponential Functions Lesson 3.1
Contrast View differences using spreadsheet
Contrast • Suppose you have a choice of two different jobs at graduation • Start at $30,000 with a 6% per year increase • Start at $40,000 with $1200 per year raise • Which should you choose? • One is linear growth • One is exponential growth
Which Job? • How do we get each nextvalue for Option A? • When is Option A better? • When is Option B better? • Rate of increase a constant $1200 • Rate of increase changing • Percent of increase is a constant • Ratio of successive years is 1.06
Example • Consider a savings account with compounded yearly income • You have $100 in the account • You receive 5% annual interest View completed table
Compounded Interest • Completed table
Compounded Interest • Table of results from calculator • Set y= screen y1(x)=100*1.05^x • Choose Table (Diamond Y) • Graph of results
Exponential Modeling • Population growth often modeled by exponential function • Half life of radioactive materials modeled by exponential function
Growth Factor • Recall formulanew balance = old balance + 0.05 * old balance • Another way of writing the formulanew balance = 1.05 * old balance • Why equivalent? • Growth factor: 1 + interest rate as a fraction
Decreasing Exponentials • Consider a medication • Patient takes 100 mg • Once it is taken, body filters medication out over period of time • Suppose it removes 15% of what is present in the blood stream every hour Fill in the rest of the table What is the growth factor?
Decreasing Exponentials • Completed chart • Graph Growth Factor = 0.85 Note: when growth factor < 1, exponential is a decreasing function
Solving Exponential Equations Graphically • For our medication example when does the amount of medication amount to less than 5 mg • Graph the functionfor 0 < t < 25 • Use the graph todetermine when
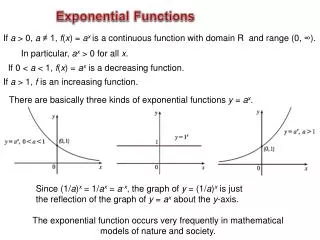
General Formula • All exponential functions have the general format: • Where • A = initial value • B = growth factor • t = number of time periods
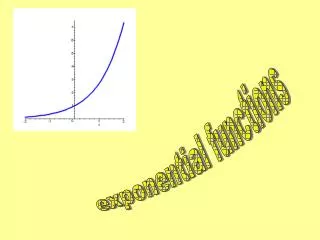
Typical Exponential Graphs • When B > 1 • When B < 1 View results of B>1, B<1 with spreadsheet
Assignment • Lesson 3.1A • Page 112 • Exercises1 – 23 odd • Lesson 3.1B • Pg 113 • Exercises25 – 37 odd