Download
1 / 1
10 likes | 90 Vues
This study explores spectroscopic patterns obtained in a plasma experiment using a W/C twin limiter at TEXTOR to investigate tungsten erosion and transport. The research compares experimental data with a 3D Monte-Carlo code, evaluating atomic data for W.I. and analyzing sputtering, erosion, deposition, and impurity transport processes.

E N D
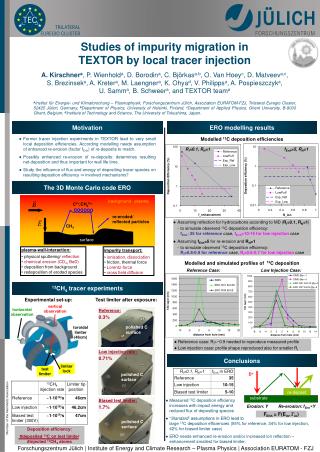
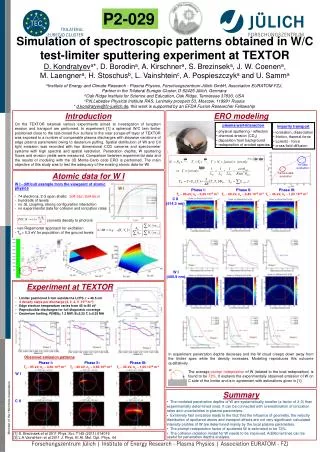
W P2-029 Simulation of spectroscopic patterns obtained in W/C test-limiter sputtering experiment at TEXTOR D. Kondratyeva*, D. Borodina, A. Kirschnera, S. Brezinseka, J. W. Coenena, M. Laengnera, H. Stoschusb, L. Vainshteinc, A. Pospieszczyka and U. Samma aInstitute of Energy and Climate Research - Plasma Physics, Forschungszentrum Jülich GmbH, Association EURATOM-FZJ, Partner in the Trilateral Euregio Cluster, D-52425 Jülich, Germany bOak Ridge Institute for Science and Education, Oak Ridge, Tennessee 37830, USA cP.N.Lebedev Physical Institute RAS, Leninsky prospect 53, Moscow, 119991 Russia * d.kondratyev@fz-juelich.de, this work is supported by an EFDA Fusion Researcher Fellowship Introduction ERO modeling On the TEXTOR tokamak various experiments aimed at investigation of tungsten erosion and transport are performed. In experiment [1] a spherical W/C twin limiter positioned close to the last-closed flux surface in the near scrape-off layer of TEXTOR was exposed to a number of comparable plasma discharges with stepwise variations of edge plasma parameters owing to deuterium puffing. Spatial distribution of WI and CII light emission was recorded with two dimensional CCD cameras and spectrometer systems with high spectral and spatial resolution. Penetration depths, W sputtering fluxes and erosion yields were measured. Comparison between experimental data and the results of modeling with the 3D Monte-Carlo code ERO is performed. The main objective of this study was to test the adequacy of the existing atomic data for WI. • plasma-wall-interaction • physical sputtering / reflection • chemical erosion (CD4) • deposition from background • redeposition of eroded species • impuritytransport • ionisation, dissociation • friction, thermal force • Lorentz - force • crossfielddiffusion He data evaluation Camera data evaluation Atomic data for W I W I - difficult example from the viewpoint of atomic physics - 74 electrons, 2-3 open shells: 5d4.6s2, 5d4.6s.nl - hundreds of levels - no SL coupling, strong configuration interaction - no experimental data for collision and ionization rates Phase I: Te ~ 85 eV, ne ~ 0,60·1019 m-3 Phase II: Te ~ 60 eV, ne ~ 0,85·1019 m-3 Phase III: Te ~ 45 eV, ne ~ 1,05·1019 m-3 C II (514.3 nm) converts density to photons - van-Regemorterapproach for excitation - Tw = 0.3 eV for population of the ground levels “ground state” W I (400.9 nm) Experiment at TEXTOR • Limiter positioned 5 mm outside the LCFS, r = 46.5 cm • 4 density steps per discharge (2, 3, 4, 5 ·1019 m-3) • Edge electron temperature varies from 45 to 85 eV • Reproducible discharges for full diagnostic coverage • Deuterium fuelling, P(NBI)= 1.2 MW, B=2.25 T, I=0.35 MA In experiment penetration depths decrease and the W cloud creeps down away from the limiter apex while the density increases. Modeling reproduces this outcome qualitatively. Observed emission patterns Phase I: Te ~ 85 eV, ne ~ 0,60·1019 m-3 Phase II: Te ~ 60 eV, ne ~ 0,85·1019 m-3 Phase III: Te ~ 45 eV, ne ~ 1,05·1019 m-3 The average prompt redeposition of W (related to the total redeposition) is found to be 73%. It explains the experimentally observed emission of W on C side of the limiter and is in agreement with estimations given in [1]. W I • Summary • The modeled penetration depths of W are systematically smaller (a factor of 2-3) than experimentally determined ones. It can be connected with overestimation of ionization rates and uncertainties in plasma parameters. • Extremely fast ionization leads to the fact that the influence of geometry, the velocity distribution of sputtered atoms and transport effects are not very significant: calculated intensity profiles of W are determined mainly by the local plasma parameters. • The prompt redeposition factor of sputtered W is estimated to be 73%. • The collision-radiation model for W needs to be improved. Additional lines can be useful for penetration depths analysis. C II [1] S. Brezinsek et al 2011 Phys. Scr. T145 (2011) 014016 [2] L.A.Vainshtein et al 2011 J. Phys. B: At. Mol. Opt. Phys. 44