Flare Radiative Energy from SDO EVE
260 likes | 469 Vues
Flare Radiative Energy from SDO EVE. Phillip C. Chamberlin phillip.c.chamberlin@nasa.gov NASA Goddard Space Flight Center, Solar Physics Laboratory. Outline. Solar EUV Experiment (SEE) and the Flare Irradiance Spectral Model (FISM) Radiative Energy Budget

Flare Radiative Energy from SDO EVE
E N D
Presentation Transcript
Flare Radiative Energy from SDO EVE Phillip C. Chamberlin phillip.c.chamberlin@nasa.gov NASA Goddard Space Flight Center, Solar Physics Laboratory
Outline • Solar EUV Experiment (SEE) and the Flare Irradiance Spectral Model (FISM) • Radiative Energy Budget • The Extreme ultraviolet Variability Experiment - EVE • Plot explanation and examples • Solar flare energetics • Impulsive phase • Long-term gradual phase RHESSI X - Annapolis, MD
TIMED SEE and FISM Solar EUV Experiment (SEE) – 3% Duty cycle Flare Irradiance Spectral Model (FISM) – Empirical model of SEE data to proxies. Can determine the radiated energy for each wavelength during solar flares for both impulsive and gradual phases of the flare. RHESSI X - Annapolis, MD
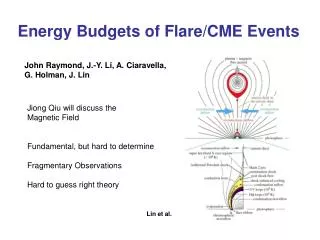
TSI Flares and VUV contribution From Woods, Kopp, and Chamberlin (WKC), JGR, 2006 RHESSI X - Annapolis, MD
October 28, 2003 - X17 - (E08, S16) November 4, 2003 - X28 - (W83, S19) TSI Revisited – C. Moore Also have data for 10/29/03, 11/2/03*, 1/15/05*, 1/19/05*, 1/20/05*, 9/7/05, 12/5/06*, 12/6/06, 12/13/06* * - Modeled TSI (can do for any flare, but these had good RHESSI data) Numbers from WKC RHESSI X - Annapolis, MD
MEGS Spectrum • Get one spectrum from 6-36 nm every 10 sec, daily from 36-105 nm • Use peak of contribution function (from CHIANTI 6.0) to pull out and combine lines. MEGS A1 MEGS A2 MEGS B Warren, 2001 RHESSI X - Annapolis, MD
MEGS Temperature Time Series • Normalized irradiance for each 0.1 log(T) bin from 4.5 to 7.3. • See impulsive phase enhancements in cooler emissions, and cooling in hot emissions. • Smoothing to longer time scales to eliminate ‘noise’ • May be actual solar variations RHESSI X - Annapolis, MD
June 12, 2010; M2.0 - AIA RHESSI X - Annapolis, MD Movie Courtesy K. Schrijver, LMSAL
June 12, 2010; M2.0 - Short • Peak 00:57 UT; DOY 163 • Gradual hot thermal emission decay for log(T)>6.8. • Coordinated 2nd Peaks (but, other small flares) • Impulsive phase seen in log(T) < 6.4 • 7 of 10 flares have an impulsive phase (larger) RHESSI X - Annapolis, MD
June 12, 2010; M2.0 - Long • Peak 00:57 UT; DOY 163 • Gradual hot thermal emission decay for log(T)>6.8. • Coordinated 2nd/3rd Peaks (but, other small flares). • Enhance 0.8-8MK plasma for ~5 hours after plots end. RHESSI X - Annapolis, MD
Long-term energy – C2.2 Flare • QEUV = 5-45 nm irradiance that is important for aeronomy studies. • Traditional flare period (28-60 min) = 2.5 mW/m2 • Longer term energy release period (60-216 min) = 9.6 mW/m2 • 79% of total energy! • Is this flare related or just ongoing active region evolution. RHESSI X - Annapolis, MD Slide modified from Woods et al, SPD, 2009
May 7, 2010; C2.0 - AIA RHESSI X - Annapolis, MD Movie Courtesy K. Schrijver, LMSAL
May 7, 2010; C2.0 - Short • GOES XRS Peak: 7:42 UT; DOY 127. • 2 Soft X-Ray peaks with gradual thermal cooling. • No impulsive phase - 3/10 flare observed “Compact”? • RHESSI derived EM (White) and Temp (Black, /2). • RHESSI and HINODE/EIS can provide more information RHESSI X - Annapolis, MD
May 7, 2010; C2.0 - Short • GOES X-Ray Peak: 7:42 UT; DOY 127. • 2 Soft X-Ray peaks with gradual thermal cooling. • No impulsive phase - 3/10 flare observed “Compact”? • EVE/ESP EUV emission all peak simultaneously and after the Soft X-Ray (0.1-7nm) peaks. RHESSI X - Annapolis, MD
May 7, 2010; C2.0 - Long • Peak: 7:42 UT; DOY 127 • Long, gradual cooling (>13 hours) • But, increased emissions in later peak are still seen in log(T)>7.0 - another, more gradual flare? RHESSI X - Annapolis, MD
May 7, 2010; C2.0 - Long • Peak: 7:42 UT; DOY 127 • Long, gradual cooling (>13 hours) • But, increased emissions in later peak are still seen in log(T)>7.0 - another, more gradual flare? RHESSI X - Annapolis, MD
Summary • There are many, interesting questions about flares that can be addressed with the new EVE data. • ‘2nd’ Peak/Cooling/Multiple Reconnections • Coronal Dimming • Impulsive Phase Enhancements • Maximum temperature of IP emissions (enhanced density) • Existence/Non-existence of impulsive phase • AIA will be critical in determining what is happening to cause these variations. • Also SOHO SEM/CDS/SUMER, HINODE XRT/EIS, RHESSI, LYRA, SOLAR, ….. • Models will also help immensely • EVE measurements will help improve FISM • Spectral resolution, accuracy, temperature dependencies RHESSI X - Annapolis, MD
Flares Studied EVE/AIA Science Team Meeting - July 2010 • Medium magnitude flares with impulsive phase. • June 12 - M2.0 • Small magnitude flare with no impulsive phase. • May 7 - C2.0 • Other flare studied but not shown here • May 5 - C8.8 • May 23-24 - B1.0 RHESSI X - Annapolis, MD
MEGS Temperature Contour • Time (X-axis) vs Temp (Y-axis) • X-axis: Hours (.Fraction of Hours) • Y-axis: Log(T) from 4.5 to 7.3 in 0.1 steps • Use peak of contribution function for each of ~90 ions used • Normalized values from Blue (0) to red to orange to yellow (1) 7.0 6.5 Temperature - log(T) 6.0 5.5 5.0 4.5 RHESSI X - Annapolis, MD
May 5, 2010; C8.8 - FISM • GOES XRS Peak 11:52 UT; DOY 125 • EVE measurements more accurately represent all temperatures • 10x spectral resolution • Impulsive and gradual phase are temperature dependent. • FISM at 1nm bins can not account for all temperature ‘blends’ in its bin • Late-phase in 1-6 MK emissions will not be modeled in FISM Black: FISM 30.0-39.9 nm Colors: EVE 0.1 nm bins RHESSI X - Annapolis, MD
ESP Time Series • ESP contains broad-band diodes around a strong emission line - but are sensitive to many blends. • 0.25 Second temporal resolution. • 0.1-7nm channel correlates with GOES XRS 0.1-0.8nm (long) channel. RHESSI X - Annapolis, MD
May 23-24, 2010; B1.0 - AIA RHESSI X - Annapolis, MD Movie Courtesy K. Schrijver, LMSAL
May 23-24, 2010; B1.0 • DOYs 143-144 • Small but very long-duration • 1st peak ~coordinated in cooler and hot emissions • Delayed 1st peak and 2nd peak in 5.0<log(T)<6.3 • Dimming seen in some emissions ~log(T)=6.3 RHESSI X - Annapolis, MD
May 5, 2010; C8.8 - AIA RHESSI X - Annapolis, MD Movie Courtesy K. Schrijver, LMSAL
May 5, 2010; C8.8 - Short • GOES XRS Peak 11:52 UT; DOY 125 • Gradual hot thermal emission decay for log(T)>6.8. • Impulsive phase only log(T) < 5.0 • ESP 27-32 nm channel show early impulsive phase, other EUV channels peak after soft X-ray channel RHESSI X - Annapolis, MD
May 5, 2010; C8.8 - Long • GOES XRS Peak 11:52 UT; DOY 125 • Multiple late peaks, cooling or more energy release? • FISM will not be able to show these multiple peaks as they are not seen in the GOES XRS proxy • May underestimate the 5-45 nm EUV emissions by 70% - Woods et al., SPD, 2010. RHESSI X - Annapolis, MD