SPSW Revision
100 likes | 201 Vues
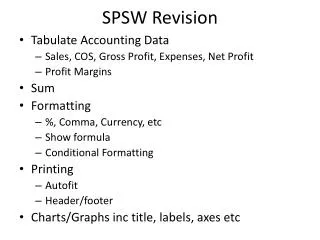
SPSW Revision. Tabulate Accounting Data Sales, COS, Gross Profit, Expenses, Net Profit Profit Margins Sum Formatting %, Comma, Currency, etc Show formula Conditional Formatting Printing Autofit Header/footer Charts/Graphs inc title, labels, axes etc. Revision task 1.

SPSW Revision
E N D
Presentation Transcript
SPSW Revision • Tabulate Accounting Data • Sales, COS, Gross Profit, Expenses, Net Profit • Profit Margins • Sum • Formatting • %, Comma, Currency, etc • Show formula • Conditional Formatting • Printing • Autofit • Header/footer • Charts/Graphs inc title, labels, axes etc
Revision task 1 • Monthly Sales 200, 315, 440, 520 • COS 100, 240, 360, 450 • Expenses 20, 30, 70, 80 • Enter data • Show Gross and Net Profits • Show Gross & Net Profit Margins • Make it look nice • Make losses stand out by changing colour • Print (with footer showing Name, Date, AAT Reg) • Copy to a new worksheet • Show formulae • Print again • Produce a suitable chart
SPSW Revision • Functions • Maximum, Minimum, Average • IF • Sort • Filter eg by date • Pivot tables
Revision Task 2 • Usain Bolt 9.58, 9.7, 9.8, 10.1, 9.9, 10.4 • Carl Lewis 9.94, 9.86, 10.0, 10.5, 9.8, 10.0 • Linford Christie 10.1, 10.3, 9.97, 10.5, 9.87, 10.1 • Enter data • Add columns showing fastest, slowest and average times • Highlight times faster than the average • Draw a suitable chart for Usain Bolt • Add a line for Linford Christie • Delete Usain Bolt • Add a trend line for Linford Christie
Revision Task 3 Division 1 Division 2 Sales 500 COS 300 Expenses 120 • Sales 200 • COS 150 • Expenses 60 • Produce a Profit & loss account showing both divisions and the total for the firm • Add Rows showing Gross and Net Profit Margins • Add an IF statement which adds the word “profit” or “loss” to the bottom of each column depending on whether the net profit is positive or negative
Revision Task 4 • Load Data File “Revision” • Sort data by “sold by” • Filter to show only Jeep sales • Copy Jeep sales to a new worksheet • Using the original task 4 data • Create a Pivot Table showing total sales by person
Revision Task 5 • The salesforce receive the following commission levels • Jeep 3% • Citroen 5% • Fiat 2.5% • Calculate the total sales by each person • Calculate the total commission received by each person • Anyone with total sales more than the average gets a bonus of 12% of their salary – add a column to show the bonuses • Calculate the total Pay for each person
Other possible issues • Data validation • Lookup • Protection
Revision Task 6 • Create a worksheet with 4 input areas as follows • Validate - DOB box as a date - Reg number as whole number between 1000 and 2000 - Region as one of North, South, East or West • Check it works • Add suitable comments to assist the user
Revision Task 7 • Enter the following Products and Prices Product ID Product Price 4034 IPhone 4S 600 3287 IPhone 3GS 319 2956 IPad 2 399 2312 Apple TV 99 1354 Ipod Shuffle 40 • Use firstly “Lookup” and secondly “Vlookup” to produce a spreadsheet as shown below. The product ID is entered by the user – both the Product name and Price are automatically generated