Download
1 / 7
70 likes | 195 Vues
This report, prepared by Roberto Gallardo in November 2012, provides an analysis of North Carolina's key industry clusters, focusing on employment trends from 2002 to 2012. It details job changes across various sectors such as Electrical, Business & Financial, and Transport & Logistics, highlighting clusters’ average earnings and growth patterns. Utilizing six-digit NAICS codes, the publication offers valuable insights into the state's economic landscape, featuring bubble charts to visualize cluster performance based on location quotients (LQ) and expenditure analyses, sourced from EMSI Complete Employment data.

E N D
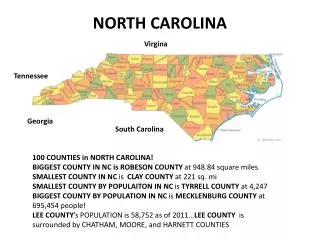
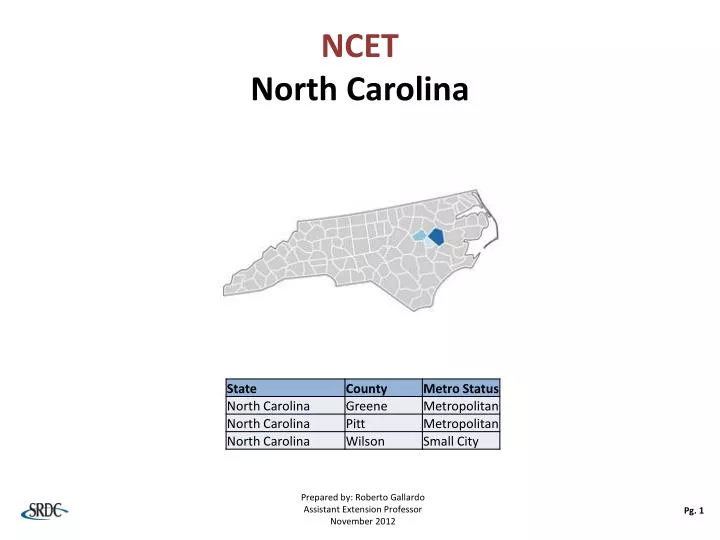
NCETNorth Carolina Prepared by: Roberto Gallardo Assistant Extension Professor November 2012 Pg. 1
NCET – North Carolina Pre-Defined* Clusters *For a list of six-digit NAICS codes industries within each cluster see separate file Source: EMSI Complete employment – 2012.2 Last Updated: October 2012 Pg. 2
NCET – North Carolina (2002-2007) Electrical 2002-2007 % Change Jobs Primary Metal Business & Financial Transp. & Logistics Transp. Equipment Education Chemicals 2007 LQ Pg. 3 Bubble size represents cluster’s average earnings in 2012 ; Source: EMSI Complete Employment – 2012.2
NCET – North Carolina (2007-2012) Mining Advanced Materials Primary Metal Biomedical Fabricated Metal Chemicals Business & Financial 2007-2012 % Change Jobs Education Transp. &Logistics Energy Agribusiness Machinery IT Telecomm. Transp. Equipment Apparel 2012 LQ Pg. 4 Bubble size represents cluster’s average earnings in 2012; Source: EMSI Complete Employment – 2012.2
NCET –North Carolina 2002-2007 Bubble Chart Results *Clusters were ranked in descending order based on their 2007 LQ Source: EMSI Complete Employment – 2012.2 Pg. 5
NCET –North Carolina 2007-2012 Bubble Chart Results *Clusters were ranked in descending order based on their 2012 LQ Source: EMSI Complete Employment – 2012.2 Pg. 6
NCET –North Carolina 2012 Expenditures & Leakage* *Only top 20 industries used to calculate the leakage Sorted in descending order based on total expenditures Source: EMSI Complete Employment – 2011.4 Pg. 7