ENERGY BALANCE ANALYSIS
200 likes | 225 Vues
ENERGY BALANCE ANALYSIS. UoB. OBJECTIVES. Quantify energy used in road transport Compare energy impact of transport policies Comparisons avoid price distortions Quantify total life-cycle energy use Energy efficiency of transport modes Quantify energy from different sources. APPLICATIONS.

ENERGY BALANCE ANALYSIS
E N D
Presentation Transcript
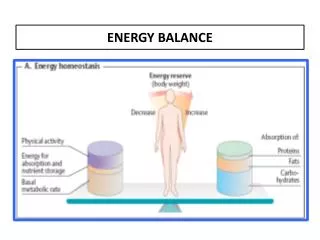
OBJECTIVES • Quantify energy used in road transport • Compare energy impact of transport policies • Comparisons avoid price distortions • Quantify total life-cycle energy use • Energy efficiency of transport modes • Quantify energy from different sources
APPLICATIONS • Network Level • Total energy use by transport mode • Long term energy requirements • Renewable energy sources • Project Level • Compare energy use for investment options • Specific energy use by transport mode
ENERGY COMPONENTS • Motorised Transport • Vehicle Operation • Fuel Production • Vehicle Manufacture • Non-Motorised Transport • Animal drawn carts, cycling, head-loading • Road Construction and Maintenance • Road works
MOTORISED TRANSPORT • Energy Use Stages • Vehicle manufacture • Fuel production • Vehicle use • Vehicle maintenance • Mainly non-renewable (fossil) fuels
VEHICLE OPERATION ENERGY • Vehicle manufacture • raw materials, processing, components, transportation, assembly, distribution • Fuel production • raw materials, stock transport, processing, distribution • Vehicle use • fuel, oil & tyre consumption • Vehicle maintenance • component manufacture, distribution
VEHICLE MANUFACTURE • Motorcycle 20 GJ • Medium car 100 • Light goods vehicle 160 • Four wheel drive 180 • Medium truck 600 • Articulated truck 1,500 • Mini-bus 300 • Large bus 1,000
FUEL PRODUCTION CYCLE Feed stock Processing Distribution End-use Crude Oil and natural gas liquids Distribution pipeline Distribution terminal Petrol, Diesel road tankers Depot storage Oil refinery Pipeline Petrol, Diesel vehicles Gas Separation plant Crude Oil Tanker Service stations
FUEL PRODUCTION ENERGY • Petrol 0.169 MJ/MJ • Diesel 0.122 • LPG 0.122 • CNG 0.061 • Electric 2.857 • Bio-methanol 0.514 • Bio-ethanol 0.510 • Bio-diesel 0.655
FUEL ENERGY CONTENT • Petrol 34.7 (MJ/Li) • Diesel 38.7 • LPG 25.5 • CNG 40.0 • Ethanol 23.9 • Methanol 18.1 • Bio-diesel 32.8
ENERGY CONTENT FACTORS • Lubricating oil 47.7 (MJ/Li) • Tyre wear 32 (GJ/Tonne) • Vehicle repair & support 2 ~ 4 % of life cycle energy • Replacement parts proportion of total life cycle energy
Energy Content Factors Lubricating Oil Tyre Wear Vehicle Repair & support Replacement parts 47.7 MJ/Li 32 GJ/Tonne 2~4% of life cycle energy proportion of total life-cycle energy
NON-MOTORISED TRANSPORT • Animal drawn Carts • animal mass, cart & load mass, speed • rolling resistance, slope • Cycling • total mass • speed • Head-loading • total mass
ROAD CONSTRUCTION AND MAINTENANCE • Energy consumed per unit of road works • Excavation (per cu.m) • Formation level • Base layers • Surfacing • Resurfacing • Rehabilitation
ENERGY BALANCE RESULTS • Total energy used • by transport mode • Total by renewable/non-renewable • by fuel type • Total national/global • Specific energy consumption • per km by mode • per passenger/km • per tonne/km
ENERGY USE ON GRAVEL ROAD Poor condition (IRI=15 m/km)
GLOBAL AND NATIONAL ENERGY (Gravel road, IRI=15 m/km)
ENERGY USE ON PAVED ROAD (Good condition, IRI = 3 m/km)
GLOBAL AND NATIONAL ENERGY (Paved road good condition, IRI = 3 m/km)
NET ENERGY CONSUMPTION (Comparison of Gravel - Paved Road) Vehicle Type National Global Cars & Utilities 0.7 0.8 0.5 Buses 0.9 2.1 1.0 Light Trucks 0.6 0.7 0.5 Medium Trucks 2.2 3.4 2.2 Heavy Trucks 3.8 5.1 4.0 (MJ/km)