ENERGY BALANCE
ENERGY BALANCE . BMR is predicted by lean body mass (i.e. total body mass - fat mass), and varies with gender and age. Extra metabolic energy is consumed during growth, pregnancy and lactation, and when febrile.

ENERGY BALANCE
E N D
Presentation Transcript
BMR is predicted by lean body mass (i.e. total body mass - fat mass), and varies with gender and age. • Extra metabolic energy is consumed during growth, pregnancy and lactation, and when febrile. • The second component of energy expenditure is determined by the level of muscular activity; this is highly variable according to occupation and lifestyle. • Finally, energy is expended during digestion of food (termed the 'thermic effect of food'), although this is a small component (< 10%) of total energy expenditure.
DAILY ENERGY REQUIREMENTS Circumstances Healthy adult females Healthy adult males At rest (1600 kcal) (2000 kcal)Light work (2000 kcal) (2700 kcal)Heavy work (2250 kcal) (3500 kcal)
Feeding and Obesity
Stretch receptors in the stomach activate sensory afferent pathways in the vagus nerve and inhibit food intake. Peptide YY (PYY), cholecystokinin (CCK),and insulin are gastrointestinal hormones that are released by ingestion of food and suppress further feeding.Ghrelin is released by the stomach, especially during fasting, and stimulates appetite. Leptin is a hormone produced in increasing amounts by fat cells as they increase in size; it inhibits intake.
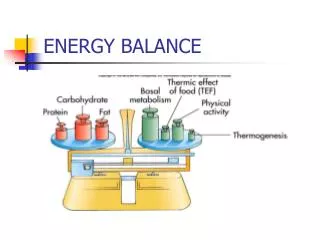
The usual tight regulation of the size of the adipose organ indicates that neural or humoral signals from the adipose organ are transmitted to the brain, which in turn regulates food seeking and consumption, and energy expenditure • Fat deposition results from the discrepancy between fat consumption and energy expenditure and maximum weight gain being achieved in middle age. • Bodily fat is stored as triglycerides in adipose tissue, which is distributed under the skin and in the breasts, buttocks, thighs, and abdomen. Adipose tissue accounts, on average, for 26 to 42% of the weight.
Definition and Measurement • Obesity is a state of excess adipose tissue mass. Although often viewed as equivalent to increased body weight, this need not be the case—lean but very muscular individuals may be overweight without having increased adiposity. • Obesity is more effectively defined by assessing its linkage to morbidity or mortality. • The distribution of adipose tissue in different anatomic depots also has substantial implications for morbidity. Specifically, intraabdominal and abdominal subcutaneous fat have more significance than subcutaneous fat present in the buttocks and lower extremities.
Although not a direct measure of adiposity, the most widely used method to gauge obesity is the body mass index (BMI), which is equal to weight/height2 (in kg/m2). • Other approaches to quantifying obesity include anthropometry (skin-fold thickness), densitometry (underwater weighing), CT or MRI, and electrical impedance.
CLASSIFICATION OF OVERWEIGHT AND OBESITY BY BMI Obesity ClassBMI(kg/m2) Underweight <18.5 Normal 18.5–24.9 Overweight 25().0–29.9 ObesityI 30.0–34.9 ObesityII 35.0–39.9 Extreme obesityIII ≥40 • Overweight for Americans is defined as a BMI between 25 and 29.9 kg/m2 and obesity is defined as a BMI of 30 kg/m2 or more. • For Asians, overweight is a BMI between 23 and 29.9 kg/m2 and obesity a BMI >30 kg/m2
Clinical features Two distinct phenotypes are apparent: Abdominal obesity(apple shaped) which is a stronger predictor of developing coronary heart disease, associated with insulin resistance and type 2 diabetes mellitus Generalized obesity(pear shaped): fat is distributed in the hips and thighs Specifically, intraabdominal and abdominal subcutaneous fat have more significance than subcutaneous fat present in the buttocks and lower extremities.
Although computed tomography (CT) and magnetic resonance imaging (MRI) are more accurate, they are too expensive to be performed for this purpose alone. • Abdominal fatness can be assessed by waist circumference or the circumference of the waist divided by the hips (WHR). • a waist circumference greater than 102 cm for men and 88 cm for women is considered high risk. These values lose their validity in patients with a BMI 35 kg/m2. • They vary according to ethnicity; an Asian female a waist circumference >80 cm and in an Asian male a value >90 cm are abnormal. • determining the waist-to-hip ratio, with a ratio 0.9 in women and 1.0 in men being abnormal.