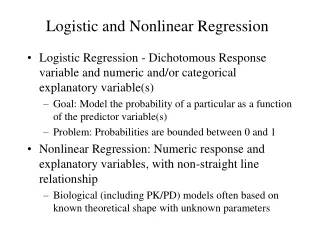
Nonlinear Regression Analysis of Heart Weights in Mammals Using Log-Log Transformation
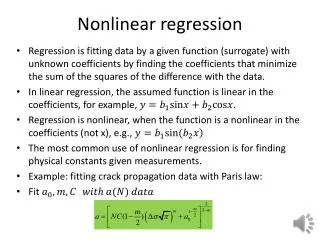
This study explores heart weights of various mammals through nonlinear regression analysis. Initially, traditional scatterplots and graphs revealed data compression, making analysis challenging. By applying semilog and log-log plots, a clearer linear relationship emerged, enhancing data visibility. The linear regression was performed using log-transformed variables, confirming a strong correlation and validating the model. Residual analysis showed a patternless scatter, indicating the appropriateness of the linear regression model. The derived equation suggests a power function, fitting biological expectations regarding mass and length relationships.

Nonlinear Regression Analysis of Heart Weights in Mammals Using Log-Log Transformation
E N D
Presentation Transcript
Nonlinear Regression Problem 4.14 Heart Weights of Mammals
Consider the following heart weights in a variety of mammals:
This plot on ordinary graph paper shows that much of the data is compressed and hard to see. The same is true for the scatterplot seen on the calculator. We can try a plot using the semilog paper.
This semilog plot is much better, but we still have a curved plot. Plotting the log y by x on the calculator gives a similar result. We can try loglog paper. This paper has a logarithmic scale for both the x and y axes.
This loglog paper allows for a wide spread of values in both the x and y dimensions.
Now showing scales for both x and y. Next we will plot the points on this log y by log x graph.
This plot is linear, or very nearly so, and we can now apply our knowledge of linear regression. Comparing this to our work on the graphing calculator, yields this scatterplot of log y by log x.
This loglog plot looks reasonable with a line to fit the data.
On my calculator, I have this arrangement of data lists: L1 is ventricle length L2 is heart weight L3 is log (ventricle length) L4 is log (heart weight) Now perform linear regression of L3 on L4 and save to Y1. We now check the residual plot. Enter the residuals in L5 using the list RESID.
Just a reminder on calculating the residuals, with the cursor on the header for L5, press <2nd> <LIST>, scroll under NAMES to RESID and select, then press <ENTER>. Now make a scatterplot of the residuals by log (ventricle length).
The scatterplot is patternless, thus confirming our use of linear regression. This also confirms our model using log x and logy. When we write our equation we must remember to write log x for x and log y for y. Recalling the regression screen: We write the equation: Note the large correlation coefficient, as well. This says that our linear relationship is very strong.
Mathematically, we tend to avoid leaving an equation in this form and convert it to an equivalent expression without the logs. or When we write the equation in the final form, it suggests more readily that this is a power function.
To check this against the original data we recreate the original scatterplot and store the final equation in Y2. (For those interested in short cuts, the values a and b from the linear regression equation are stored in the VARS Statistics EQ register. Press <VARS> <5:Statistics> < EQ> then <2:a> or <3:b>.) So you may enter the equation in Y2, as shown, or just type it in using the numbers instead of a and b: This looks like a very good model for the data. It also fits our knowledge of mass being third order while length is first order.